To really get an accurate handle on tumor volume, we have to move beyond just measuring the longest line across a tumor. The modern approach uses 3D data from medical imaging like CT or MRI scans. This involves carefully outlining, or segmenting, the tumor on each individual image slice and then using some clever math to combine those areas into a single, precise volume. It gives us a far more reliable picture of the actual tumor burden.
Why Precise Tumor Volume Is a Game Changer in Oncology
Before we jump into the "how-to," it’s crucial to understand why this measurement is so important. Calculating tumor volume isn't just a technical exercise; it's a core part of modern cancer care and research. It provides a much deeper, more nuanced understanding of how a tumor is behaving compared to the old-school, one-dimensional measurements.
Think of it this way: measuring a tumor by its longest diameter is like guessing the size of an iceberg based only on the tip you see above the water. It gives you an idea, but you're missing the vast majority of the story. An irregularly shaped tumor might not be growing much in length, but it could be expanding significantly in other directions. This is where volumetric data gives us a huge advantage.
Moving Beyond Simple Measurements
For decades, clinicians relied on simple metrics like the longest diameter to track tumor size. It was quick and easy, but we now know it can be incredibly misleading. A tumor could be shrinking in response to treatment, but if its shape becomes more spherical, the longest diameter might not change much at all, completely masking a positive response.
Volumetric analysis fixes this by giving us a comprehensive, three-dimensional measurement. This precision provides a much more sensitive and reliable indicator of how a tumor is truly responding to therapy.
Tracking volumetric changes over time lets oncologists make faster, more informed decisions. If a tumor's volume isn't shrinking as expected with a particular chemo regimen, they can switch to a different treatment plan much sooner, which can directly lead to better patient outcomes.
The Impact on Clinical Decisions
The benefits of this detailed approach show up in everyday clinical practice. Imagine a patient on a targeted therapy. With volumetric tracking, we can detect subtle but significant reductions in tumor size that would otherwise be missed. This early feedback confirms the treatment is working, offering both reassurance to the patient and a clear path forward for the clinical team.
This level of detail is especially powerful when we need to distinguish tumor responses based on their underlying biology. For instance, research has shown that volumetric measurements are significantly more sensitive than one-dimensional ones for assessing how well a treatment is working, particularly in tumors with specific genetic mutations.
One study found that tumors with EGFR mutations showed a median volume reduction of 45.9% with volumetric analysis, compared to just an 11.1% reduction using older methods. That’s a massive difference, and it highlights how volumetric data can reveal the true impact of targeted therapies. You can dig into these important findings on treatment response to see the data for yourself.
Ultimately, a precise calculation of tumor volume gives us:
- Enhanced Sensitivity: It picks up on small changes in tumor size that simpler methods miss.
- Improved Accuracy: It provides a true picture of the tumor burden, no matter how weirdly shaped it is.
- Faster Decision-Making: It offers clear, early feedback on whether a treatment is working.
By embracing this more detailed approach, oncology is taking a big step toward a more quantitative and personalized era of patient care.
Getting Back to Basics: The Foundational Measurement Techniques
Before we dive into the world of high-tech imaging, it’s important to have a solid grasp of the old-school methods for calculating tumor volume. The most common and long-standing technique, particularly in preclinical research, is the good old-fashioned caliper measurement. It’s a hands-on approach that's simple and fast, especially when advanced imaging isn't available or practical.
The process itself is quite direct. A researcher simply uses calipers to measure the tumor's longest dimension, which we'll call the length, and then its shortest dimension at a right angle, the width. These two numbers get plugged into a standard formula to get a volume estimate.
Putting the Ellipsoid Formula to Work
The go-to equation for this method is V = (π/6) × length × width². This formula treats the tumor as a prolate ellipsoid—think of it as a slightly squashed sphere, almost like a tiny watermelon. For many early-stage, uniform tumors, this assumption actually works pretty well.
Let's imagine a researcher measuring a subcutaneous tumor on a lab mouse. They might get a length of 10 mm and a width of 6 mm. Using the formula, the math looks like this:
V = (3.14159 / 6) × 10 mm × (6 mm)²
V ≈ 0.5236 × 10 × 36
V ≈ 188.5 mm³
This gives you a quick, tangible number that’s incredibly useful for tracking tumor growth over time in a controlled lab setting. But, as you might guess, that convenience comes with some serious limitations.
Where Caliper Measurements Come Up Short
The biggest problem with the caliper method is baked right into its core assumption. Tumors are rarely perfect shapes. As they grow and progress, they often become irregular, developing lobes, indentations, and all sorts of asymmetrical features that a simple two-dimensional measurement just can't account for.
This is where the model really starts to fall apart. An oddly shaped tumor might have the same length and width as a smooth ellipsoid but a wildly different actual volume. Relying on this overly simplified formula for these complex tumors can lead to significant errors, potentially skewing conclusions about how well a treatment is working.
The real issue is that calipers only capture the outer boundaries along two axes. The method completely ignores the tumor's depth and internal complexity, forcing a geometric guess that gets less and less accurate as the tumor's shape gets weirder.
Research has shown just how big these inaccuracies can get. Even if you measure the length and width perfectly, the formula's dependence on an ideal shape can produce errors as high as 18.4%. This error margin isn't even consistent; smaller tumors might have an error rate closer to 7%, but that can skyrocket to almost 27% in larger, more complex tumors. To really dig into these measurement challenges, you can explore the data on caliper-based inaccuracies.
This variability makes it crystal clear why, for critical clinical decisions and high-stakes research, moving to imaging-based volumetric analysis isn't just a minor upgrade—it's essential for getting the accuracy you need.
Comparison of Tumor Measurement Methods
To put it all in perspective, here's a quick look at how traditional caliper measurements stack up against modern volumetric imaging from CT or MRI scans.
| Feature | Caliper Measurement | Volumetric Imaging (CT/MRI) |
|---|---|---|
| Accuracy | Low to moderate; highly dependent on tumor shape and uniformity. | High; provides a true 3D representation of the tumor's size and shape. |
| Complexity | Simple and fast; requires minimal training. | Complex; requires specialized equipment and trained operators. |
| Cost | Low; only requires a set of calipers. | High; involves expensive imaging machines and software. |
| Information | Provides a 2D-based volume estimate only. | Offers detailed data on internal structure, depth, and irregularity. |
| Best Use Case | Quick, repetitive measurements in preclinical models with uniform tumors. | Clinical decision-making, complex tumor assessment, and high-precision research. |
While calipers certainly still have their place, especially in early-stage research, the data shows that when precision is paramount, there's no substitute for looking at the whole picture with volumetric imaging.
A Practical Walkthrough of Image-Based Calculation
Let's move from theory to the real world and walk through exactly how to calculate tumor volume using medical images like CT or MRI scans. At its core, this process is about taking a series of flat, 2D pictures and turning them into a single, highly accurate 3D measurement. The whole thing hinges on a critical first step: image segmentation.
Segmentation is simply the process of carefully outlining the tumor’s boundaries on every single image slice where it appears. This can be done by a radiologist drawing the lines by hand—a meticulous method that’s precise but can be incredibly time-consuming.
Thankfully, semi-automated tools can give clinicians a head start by suggesting boundaries, which they can then quickly refine. And now, fully automated AI methods can do the job in seconds, bringing both speed and a high degree of consistency to the table.
From 2D Area to 3D Volume
Once the tumor has been outlined on each slice, the software calculates the area inside those lines. We call this the Region of Interest (ROI). For every individual slice, the system computes this area in square millimeters (mm²). Think of it like creating a stack of digital cutouts, where each one is a paper-thin cross-section of the tumor.
The final step is to put it all together and reconstruct the volume. We simply add up the areas of all the ROIs from every slice. This total area is then multiplied by the slice thickness—the known distance between each consecutive image—to get the final volume. So, if a CT scan was taken with a slice thickness of 2 mm, the total calculated area gets multiplied by 2 to give us the volume in cubic millimeters (mm³).
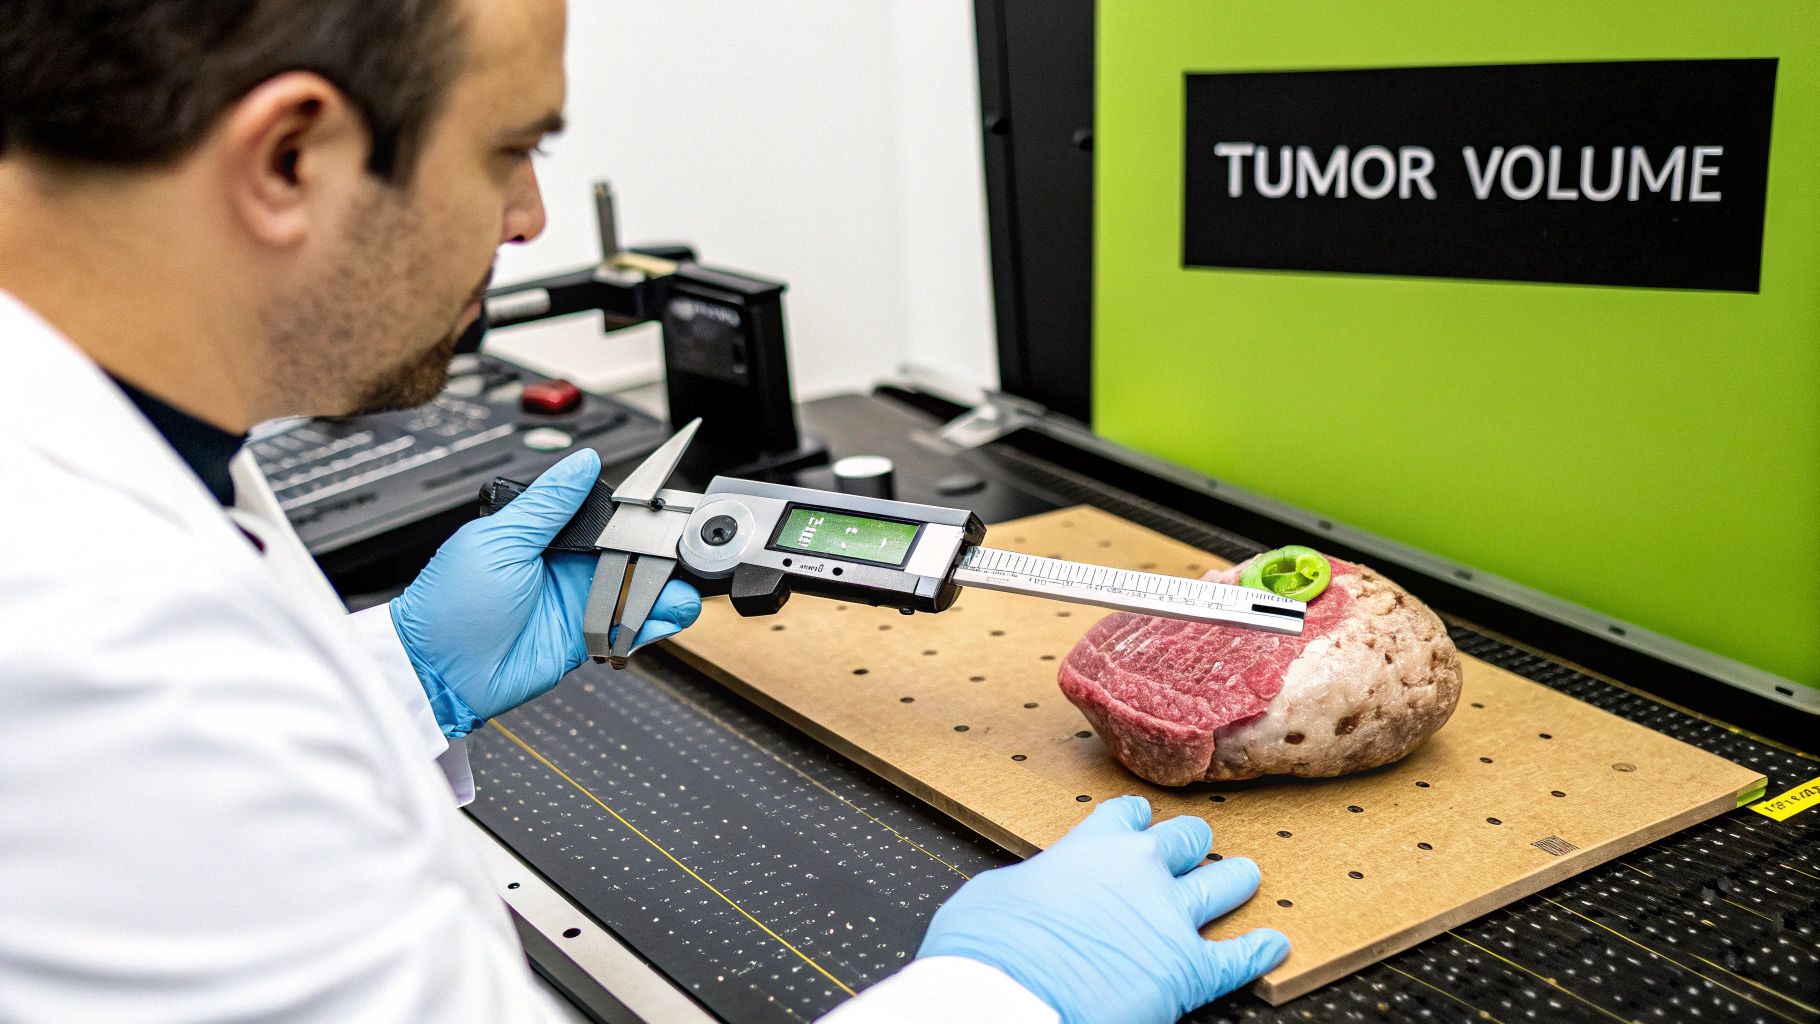
This image gives a great visual breakdown of the basic logic behind using dimensions to figure out volume.

It really clarifies the fundamental inputs you need for any kind of volume calculation, simplifying a common formula used for quick estimations.
A Simplified Calculation Example
Let's make this crystal clear with a quick example. Imagine we have a small tumor that shows up on three consecutive MRI slices, and we know the slice thickness is 3 mm.
- Slice 1: The segmented area (ROI) is 10 mm².
- Slice 2: This is the widest part of the tumor, with an ROI of 15 mm².
- Slice 3: The tumor starts to taper off here, with a smaller ROI of 8 mm².
First, we just add up the areas: 10 mm² + 15 mm² + 8 mm² = 33 mm².
Next, we multiply that total area by the slice thickness to find our volume: 33 mm² × 3 mm = 99 mm³.
This "summation of areas" approach, sometimes called the "voxel counting" technique, is far more accurate than formulas that rely on caliper measurements. Why? Because it accounts for the tumor's true, often irregular, shape slice by slice, rather than assuming it's a perfect sphere or ellipsoid.
For anyone who wants to dive deeper into the tools that power this kind of image analysis, this guide on Python programming for data analysis is a fantastic starting point for understanding how to work with this kind of data.
How AI Is Changing the Game in Tumor Volumetry
Anyone who has manually segmented a tumor knows the grind. It’s slow, tedious work that demands intense focus from a highly trained specialist, and even then, the results can vary from one expert to another. This is exactly where Artificial Intelligence (AI) is stepping in and making a massive difference in medical imaging by automating the whole process with incredible speed and consistency.
What used to be a painstaking, hours-long task of outlining a tumor slice-by-slice can now be done in seconds. An AI model can tear through an entire scan and generate a precise, 3D segmentation almost instantly. This doesn't just save time; it frees up clinicians to focus on what really matters—interpreting the data and planning patient treatment, not getting bogged down in digital busywork.
The Magic Behind Automated Segmentation
So, how does it work? At the core of these AI systems are powerful deep learning models, with architectures like U-Net being a real standout for image segmentation. These models are not just programmed; they’re trained. We feed them thousands of medical scans where tumors have already been meticulously outlined by human experts.
Through this intensive training, the AI learns to pick up on the subtle textures, shapes, and patterns that differentiate a tumor from the healthy tissue surrounding it. The result is a tool that can replicate, and in some cases even surpass, human accuracy for this specific task.
The biggest win here is eliminating inter-observer variability. Two radiologists might segment the same tumor with slight differences, leading to inconsistent volume measurements. An AI model, on the other hand, delivers the exact same segmentation every single time. It's perfectly reproducible.
This image shows just how accurate these models can be. The AI's automated segmentation is in red, while the "ground truth" outline from a human expert is in blue.
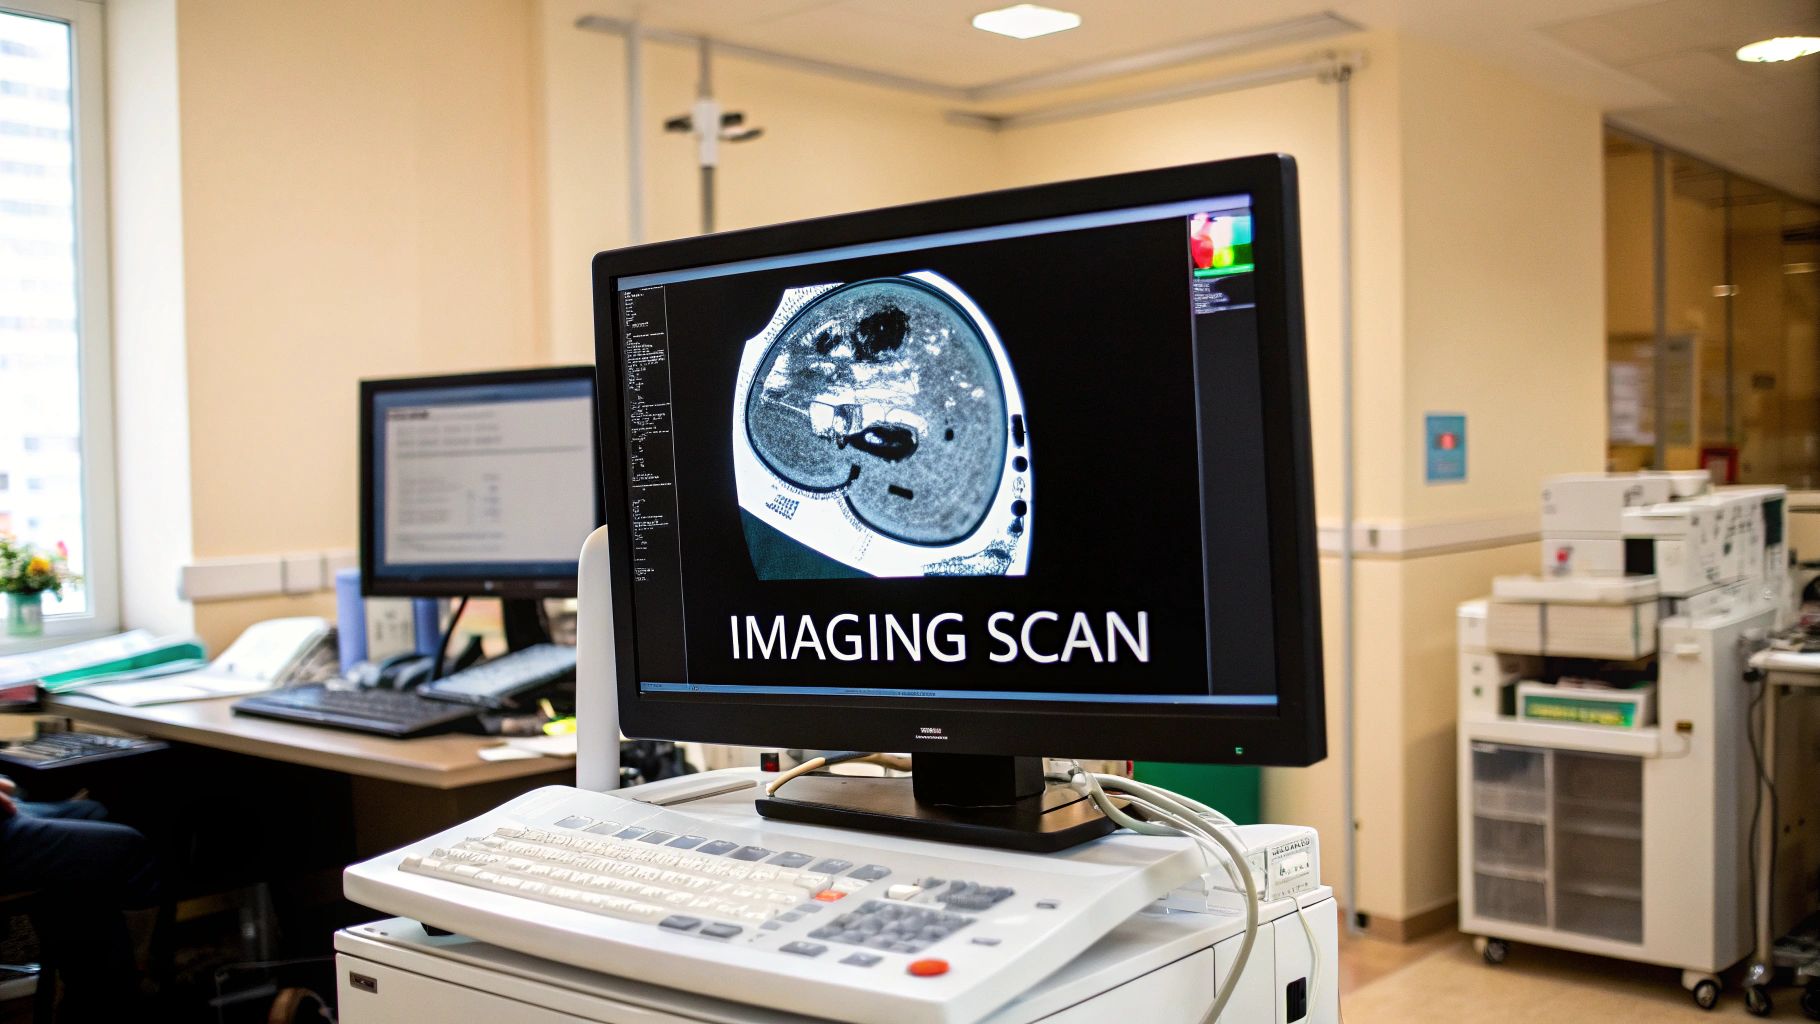
You can see the overlap is incredibly tight, showing that the algorithm has effectively learned to mimic an expert’s delineation with the efficiency of a machine.
Practical Wins for the Clinic and the Lab
The real-world impact of AI-driven tumor volumetry is huge, and it goes well beyond simply saving a few hours. For instance, researchers have built models that can identify 85% of aggressive prostate tumors from MRI scans, providing volumetric data that directly informs the prognosis.
AI's true strength is its consistency and scalability. An algorithm can analyze hundreds of scans without getting tired or losing focus, making large-scale research studies possible in a way that just wasn’t feasible with manual methods. This is how we start discovering new biomarkers and understanding diseases on a much deeper level.
The best part is that you don't need a computer science degree to use these tools. Several fantastic software platforms have integrated powerful AI features, putting this technology right at your fingertips.
- 3D Slicer: This is an open-source powerhouse. It has a massive ecosystem of extensions, including plenty of AI-powered segmentation tools you can easily add to its already robust functionality.
- ITK-SNAP: Another go-to free tool, ITK-SNAP was designed from the ground up for segmentation. It’s known for being user-friendly, and its semi-automated features are getting a serious boost from AI.
Think of these tools not as replacements for clinicians, but as incredibly capable assistants. They do the heavy lifting of segmentation, providing a solid, reliable starting point that an expert can then quickly review, adjust if needed, and approve. This human-in-the-loop approach gives you the best of both worlds: the accuracy of an expert eye and the incredible efficiency you need to calculate tumor volume at scale.
Using Volume Data for Predictive Modeling

A single tumor volume measurement is just a snapshot in time. The real clinical power comes alive when you start tracking these measurements across multiple scans. This longitudinal data turns a static number into a dynamic story, revealing exactly how a tumor is behaving and responding to treatment. We’re no longer just assessing size; we're starting to predict its next move.
This is the core idea behind quantitative oncology—using mathematical models to get ahead of the disease. By closely monitoring volumetric changes, oncologists can calculate critical metrics that act as potent biomarkers. This gives them a much clearer, faster signal on treatment effectiveness than older, more subjective methods ever could. It’s here that the painstaking effort to calculate tumor volume truly pays off.
Key Metrics for Tracking Treatment Response
Instead of just looking at the absolute volume, the focus for clinicians and researchers is the rate of change. This dynamic view provides far deeper insights into the tumor’s biology and its reaction to therapy.
Three of the most important metrics we work with are:
- Tumor Size Ratio (TSR): A straightforward comparison of the current tumor volume against its original baseline volume. It’s a simple, clear percentage of shrinkage or growth.
- Tumor Growth Rate (kG): A more sophisticated metric that calculates the exponential rate of change in volume. This essentially tells you the speed of growth or regression.
- Time-to-Tumor Growth (TTG): This measures how long it takes for a tumor to start growing again after it initially responded to treatment. It's a key marker for how durable a treatment is.
Think of these metrics as early warning systems. A rapidly climbing TSR or a high kG value can signal that a therapy isn't working, giving a clinical team the data they need to pivot to a new strategy weeks or even months sooner.
By quantifying the speed and direction of these volume changes, we create powerful predictive tools. This data feeds directly into models that can help forecast patient outcomes, like overall survival, with growing accuracy.
A 2023 simulation study really drove this home by exploring how well these metrics predict survival. The research found that measuring tumor size for just 12 weeks gave highly accurate TSR estimations for 91% of patients, cementing it as a reliable early predictive marker.
On the other hand, growth rate metrics like TTG and kG needed more time to tell their story, requiring longer follow-up periods of 42 to 60 weeks to become truly dependable. You can discover more about these predictive modeling findings and see how this plays out clinically. It's a great example of how different metrics provide value at different stages of monitoring.
Ultimately, this whole approach is about making cancer care more proactive. It’s a fundamental shift from reacting to what we can see on a scan to anticipating it based on solid quantitative trends, opening the door for truly personalized and adaptive treatment strategies.
Diving Deeper: Common Questions on Calculating Tumor Volume
Once you get the hang of the basic methods, you'll inevitably run into some specific, real-world questions. It’s totally normal. Blending clinical insight with technical execution is where the real learning happens. Let’s walk through some of the questions I hear most often to clear up the gray areas.
CT or MRI: Which One Is Better for the Job?
This is probably the first question everyone asks. The honest answer? It really depends on what you're looking at. There's no single "best" modality for every situation.
MRIs are fantastic when it comes to soft-tissue detail. If you're trying to map out a tumor in a complex area like the brain, the high contrast an MRI provides is invaluable for seeing exactly where the tumor ends and healthy tissue begins.
On the other hand, CT scans are the workhorses for many other cases. They're quick, widely available, and great for tracking changes in the lungs, liver, or abdomen. The key isn't which one is universally better, but which one gives you the cleanest, most definitive look at the tumor's edges for a specific patient and cancer type.
Manual vs. AI Segmentation: The Accuracy Debate
This is a big one right now. For years, manual segmentation by a skilled radiologist was the undisputed gold standard. But it has a well-known Achilles' heel: inter-observer variability. Give the same scan to two different experts, and you'll get two slightly different outlines—and two different volume measurements.
This is where AI really starts to shine. A well-trained model offers remarkable consistency. It will segment the exact same tumor in the exact same way every single time, which completely removes that human variability from the equation. In head-to-head comparisons, many modern algorithms are already performing at or even above the level of their human counterparts.
The real magic, though, often happens when you combine the two. Let the AI do the heavy lifting with a fast initial segmentation, then have a human expert give it a quick review and make any necessary tweaks. This approach gives you the speed of the machine plus the final sign-off of a clinical professional.
What About Tumors with Weird Shapes?
Let's face it, tumors rarely look like perfect spheres. They're often complex, lumpy, and can have hollowed-out or dead (necrotic) areas inside. This is exactly where simple caliper measurements fall flat and why true volumetric calculation is so powerful.
The slice-by-slice method we've discussed is built for this complexity. It doesn't care how irregular the tumor's shape is because it’s calculating the real area on each individual 2D slice before adding them all up.
Here’s how you’d typically handle these tricky features:
- Necrotic Cores: The decision to include or exclude these dead zones often comes down to clinical protocol. Sometimes, tracking the volume of just the active tumor tissue is a critical sign of how well a treatment is working.
- Infiltrating Edges: This is where a radiologist's experience is crucial—spotting the faint, blurry line where a tumor is invading healthy tissue.
- Multiple Lesions: When a patient has more than one tumor, each one is segmented and measured on its own. These values are then often added together to calculate the patient's total tumor burden.
This detailed process ensures the final volume isn't just an estimate; it's a number that accurately reflects the tumor's true, three-dimensional complexity, giving doctors the solid data they need to make the best possible decisions.
At PYCAD, we build the AI solutions that make this kind of precision and efficiency a reality in medical imaging. We specialize in training and deploying custom models that automate demanding tasks like tumor segmentation. If you're looking to bring this capability to your medical imaging projects, let's talk.