When it comes to quantitative image analysis, everything starts with good segmentation. It’s the process of digitally isolating the objects you care about—like individual cells, nuclei, or organelles—so you can actually measure them. For researchers in the trenches, ImageJ and its souped-up sibling, Fiji, are the undisputed champions of open-source tools for this critical task.
This guide is built to be your hands-on companion, taking you from a fresh install to generating clean, quantifiable data.
Why ImageJ Is Your Go-To for Scientific Segmentation
If you're working with scientific images, you know that a picture is just the beginning. The real goal is to pull out meaningful numbers. Segmentation is what gets you there. It's how we digitally draw a line around our objects of interest, separating them from the background and turning a picture into data points.
Without this step, tasks like measuring cell size, counting particles, or analyzing tissue composition would be a non-starter.
ImageJ delivers a powerful, free solution that has become a cornerstone of research labs around the world. Its long history and dedicated user base have made it an incredibly reliable platform for image segmentation. This is especially important today. As the funding landscape for biomedical research continues to shift, having access to high-caliber, no-cost tools like ImageJ is more essential than ever for keeping projects moving forward.
ImageJ vs Fiji What Researchers Need to Know
For newcomers, the "ImageJ vs. Fiji" question often comes up. Think of Fiji as ImageJ with all the essential batteries included. Here's a quick breakdown to help you decide which is better suited for your segmentation work.
| Feature | Standard ImageJ | Fiji (Fiji Is Just ImageJ) |
|---|---|---|
| Core Functionality | The original, lightweight image processing engine. | Built on the same ImageJ core, so all base functions are present. |
| Plugin Management | Requires manual installation of plugins and libraries. | Comes pre-packaged with a huge library of popular plugins and an automatic updater. |
| Ease of Use | Steeper learning curve for beginners; you build your own toolkit. | Much more user-friendly out of the box, especially for complex bio-imaging workflows. |
| Typical Use Case | Simple, routine tasks or when a minimal installation is preferred. | Complex segmentation, 3D/4D analysis, and anyone wanting a ready-to-go scientific toolkit. |
Ultimately, Fiji is the recommended starting point for nearly all scientific segmentation tasks. It saves you the headache of hunting down and managing plugins yourself.
The Power of an Open-Source Ecosystem
First released back in 1997, ImageJ has grown into a titan of biological and medical image analysis. Its real power comes from its open-source foundation and a massive, community-driven ecosystem of plugins that let you customize it for virtually any task.
The numbers speak for themselves. The core ImageJ paper has been cited over 33,000 times, a testament to its impact. Modern plugins like StarDist and SAMJ now bring sophisticated AI models into the fold, allowing for incredibly precise segmentation of complex structures with accuracy rates often hitting above 90%.
For many researchers, the choice isn't just about software features; it's about joining a global community dedicated to collaborative science. The extensive documentation, active forums, and wealth of user-created plugins mean you're never truly starting from scratch.
This guide is all about practical application. We’ll jump right into configuring your setup with the right plugins and mastering techniques that range from simple thresholding to advanced AI-powered workflows. My goal is to give you the practical advice you need to get from a raw image to publication-ready data, without the fuss.
Getting Your Workspace Ready for Serious Analysis
Before you can even think about segmenting images, you need to get your digital workbench in order. A clean, well-equipped Fiji setup is the secret to a smooth workflow. The real magic of Fiji isn't what comes out of the box; it's the massive library of plugins developed by the scientific community. Getting comfortable with managing these is your first real step toward advanced analysis.
Fiji makes this pretty painless with its built-in Updater. Think of this tool as a gateway to different "update sites"—specialized app stores for scientists. By tapping into the right sites, you get instant access to powerful algorithms without the headache of manual installations.
Tapping into Community Plugin Sites
First things first, you have to tell Fiji where to find these extra tools. Head over to Help > Update..., and once the updater window pops up, click on Manage update sites. You'll see a long list, but many of the best ones aren't turned on by default.
For the kind of high-level segmentation we're doing, especially with AI, a few sites are non-negotiable. I always make sure these are enabled:
- CSBDeep: This is your source for deep learning powerhouses like StarDist and CARE.
- BioVoxxel: An absolute gem for pre-processing. It's packed with fantastic tools for cleaning up images before you even start segmenting.
- IBMP-CNRS: A collection of specialized plugins from leading bioimage analysis groups.
Just tick the checkbox next to each one you want, hit Close, and then Apply changes. Fiji will handle the download and installation. Give it a quick restart, and your new tools will be ready to go.
Installing the SAMJ Plugin: Your AI Assistant
One of the most exciting tools to come out recently is the SAMJ plugin. This thing is a game-changer. It integrates the powerful Segment Anything Model (SAM) right into Fiji, which can slash the time you spend manually tracing objects.
Getting it installed requires adding its specific update site, which is a straightforward process.
Start by opening the updater again (Help > Update...) and go back to Manage update sites. This time, click the Add update site button. A small box will appear.
For the name, just type in "SAMJ" to keep it simple. Then, paste in this URL: https://sites.imagej.net/SAMJ/
Click OK, and you’ll see your new "SAMJ" site in the list. Make sure you check the box next to it to activate it!
Finally, click Apply changes and restart Fiji one more time.
Don't skip this setup. Taking five minutes now to install SAMJ and the other key plugins will save you hours of painful, manual tracing down the road. You're essentially adding an AI-powered assistant to your workflow, letting you focus on answering your research questions instead of fighting with the software.
Applying Foundational Segmentation Techniques
Your journey into image segmentation with ImageJ almost always starts with a foundational and surprisingly powerful technique: global thresholding. This is the first tool you should reach for when you have images with a clear difference between bright objects and a dark background, a very common sight in fluorescence microscopy.
The concept is simple. It sets a single intensity value as a cutoff. Any pixel brighter than that value gets counted as part of your object, and everything darker is considered the background.
To dive in, head to Image > Adjust > Threshold. This opens up your main control panel for the whole process. You'll see the image's histogram—a graph showing how pixel intensities are distributed—which is your key to making a good decision. The red overlay on your image gives you a real-time preview of what your final segmented result will look like as you adjust the settings.
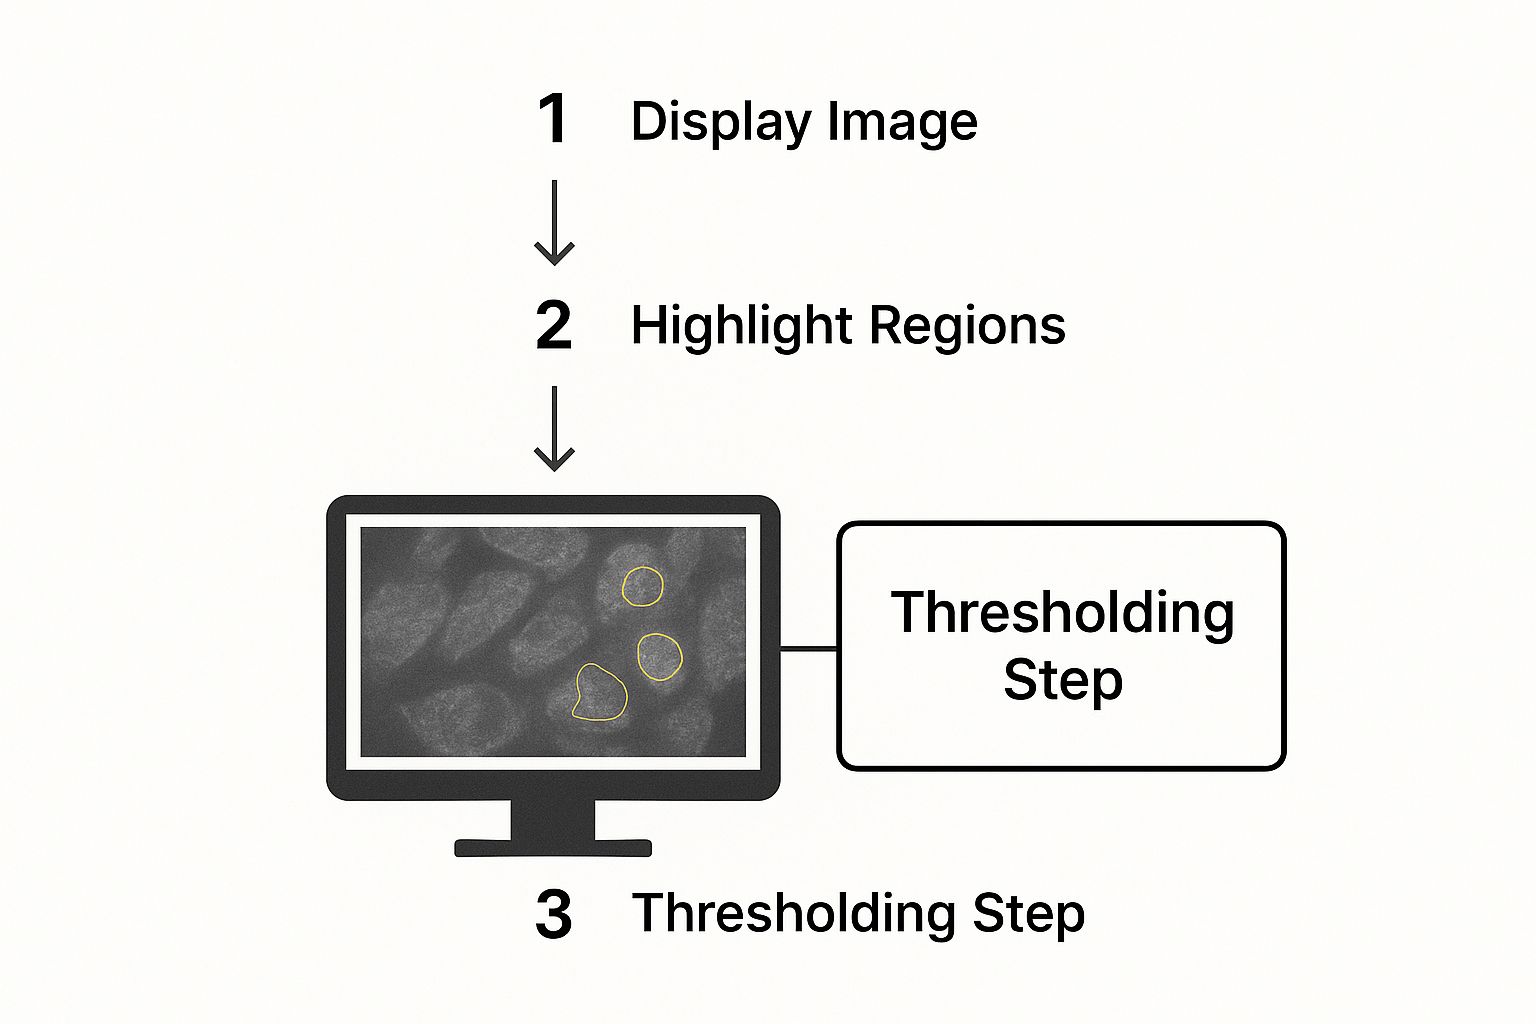
You can see in this example how the software highlights pixels above a certain intensity. This is the core of separating your objects of interest from the background before you start measuring anything.
Choosing the Right Automated Algorithm
The good news is you don't always have to guess the perfect threshold value. ImageJ comes packed with a bunch of automated algorithms that analyze your image's histogram to find the optimal cutoff for you. The real skill is knowing which algorithm works best for your specific image.
Here are a few of the most reliable options you'll find in the dropdown menu:
- Otsu: This is the undisputed workhorse for images with bimodal histograms—where you have two distinct peaks representing background and foreground. If you have a high-contrast image, start here.
- Triangle: Got a dim signal? If the foreground peak on your histogram is small and tucked right up against the background peak, the Triangle method is often the perfect tool for the job. It’s fantastic at pulling out faint objects that other methods might miss.
- Moments: This one is a close cousin to Otsu but can be a bit more resilient in the face of image noise. It's a solid choice when your images aren't quite picture-perfect.
Picking an algorithm from the menu will automatically set the threshold sliders. This gives you an excellent starting point that you can then tweak by hand if necessary.
My advice? Always cycle through a few different algorithms. It takes literally seconds, and you’ll often be surprised when one method dramatically outperforms the others for a particular image. This can save you a ton of time on cleanup later.
When Automation Falls Short: Manual Intervention
Automated methods are great, but they aren't magic. You'll inevitably run into images with complex, irregularly shaped objects that basic thresholding just can't seem to isolate cleanly. This is exactly where the manual tools prove their worth.
The Freehand selection tool is your best friend in these scenarios. It lets you trace the precise outline of any object you need. Yes, it’s more time-consuming, but for those really tricky structures, the accuracy is simply unmatched. Once you’ve traced your selection, just hit the T key to add it to the ROI Manager, which saves it for later analysis.
Separating Clumped Objects with the Watershed Algorithm
One of the most common headaches in biological image analysis is dealing with objects that are touching or clumped together, like cells in a dense culture. If you try to analyze them as-is, ImageJ will see them as one giant object, completely throwing off your data.
The classic fix for this is the Watershed algorithm.
To use it, you first need to convert your image to a binary (pure black and white) format.
- Start by applying your preferred thresholding method to create a binary "mask" of your objects.
- With that done, just run the
Process > Binary > Watershedcommand.
The algorithm cleverly treats your objects like little hills on a topographic map. It then finds the lowest points between touching "hills" and draws a one-pixel-wide line to separate them. This simple but brilliant step ensures each cell or particle is counted individually, leading to a massive improvement in the accuracy of your analysis.
AI-Powered Segmentation: A Smarter, Faster Way
Let's be honest, manually tracing hundreds of cells is a nightmare. It’s not just boring; it’s a major source of user bias and a huge bottleneck in research. This is where AI tools for ImageJ completely change the game, turning hours of tedious clicking into a few seconds of smart computation. One of the best examples is the SAMJ plugin, which offers a brilliant, interactive approach that combines AI speed with your expert eye.
The workflow is fundamentally different from traditional thresholding. Instead of messing with pixel intensity sliders, you simply guide the model. You click once on the object you want to segment (a foreground prompt) and then on the area just outside of it (a background prompt). That’s it. The AI uses that context to generate a remarkably precise selection almost instantly.
This approach is a lifesaver when you're dealing with objects that have tricky, irregular boundaries or when you're analyzing noisy images where normal techniques just can't get a grip. Think about a crowded histology slide—manually outlining every single cell would take forever. With SAMJ, it becomes a quick point-and-click exercise.
How the "Segment Anything" Model Works in ImageJ
AI integration in ImageJ has taken a massive leap forward, and plugins like SAMJ are leading the charge. This tool uses the powerful Segment Anything Model (SAM), an AI designed to delineate objects with incredible accuracy from just a few user clicks. It's built to run in real-time, even on a standard lab computer.
This is a direct answer to one of the biggest holdups in biomedical image analysis: the sheer amount of work involved in manual annotation. SAMJ brings one-click installation and interactive AI annotation right into your ImageJ/Fiji workspace, slashing the time and expertise needed for complex segmentation tasks. You can read more about how these tools are impacting scientific imaging studies.
This interactive process does more than just save time—it leads to more objective and reproducible results. By minimizing manual tracing, you cut down on the variability that creeps in from human error or different interpretations of where a boundary truly lies.
A Quick Guide: Segmenting a Histology Image
Let's walk through a real-world scenario. You've got a histology image loaded up, and it's packed with cells you need to count and measure. Classic thresholding is struggling because the stain isn't perfectly even, and some cells are touching.
Here’s how you’d handle it with SAMJ.
- First, get your image open in Fiji.
- Next, fire up the plugin by going to
Plugins > Segmentation > SAMJ. This brings up the main control panel. - Now for the magic. With the SAMJ window open, your cursor is live. Click right in the middle of a cell you want to segment. That’s your foreground point.
- Then, click in an area just outside the cell. This is your background point, telling the model what not to include.
- Instantly, the plugin draws a highly accurate selection around the cell. Just hit the
Tkey on your keyboard, and that selection gets added to the ROI Manager for later analysis.
You just repeat this simple click-and-confirm process for every cell. A task that could have easily eaten up an entire afternoon of careful tracing is now done in minutes. This workflow gives you accurate, quantifiable results in a fraction of the time, so you can get back to the actual science behind your images. The efficiency boost makes high-throughput analysis a practical reality, not just a theoretical possibility.
Extracting Meaningful Data From Your Segments
Getting your image segmentation in ImageJ to look right is a huge step, but the real science begins now. The goal isn't just to draw outlines; it's to turn those outlines into hard numbers you can actually work with. Once you've defined your objects, whether through a simple threshold or a more complex AI plugin, they become what ImageJ calls Regions of Interest (ROIs). This is where the analysis truly kicks off.
The main workhorse for this job is tucked away under Analyze > Analyze Particles.... This command is the bridge from your visual segmentation to quantitative data. It's an incredibly robust feature that does more than just count things—it measures them in detail, giving you a powerful way to filter and analyze your results.
Filtering and Measuring Your Segments
Before you hit "OK," you need to tell ImageJ what's important and what's just noise. It's almost guaranteed you'll have some small, irrelevant specks or artifacts left over from the segmentation process. You definitely don't want those cluttering up your dataset. This is where setting size and circularity constraints comes in handy.
Inside the Analyze Particles dialogue box, you can define a pixel area range. For example, setting the size from 100-Infinity tells ImageJ to completely ignore any little dots smaller than 100 pixels. It’s a simple, effective way to clean your data on the fly.
You can do the same for shape. The circularity filter, which runs on a scale from 0.0 (a straight line) to 1.0 (a perfect circle), is fantastic for isolating objects with a specific morphology, like round cell nuclei in a crowded field of view.
The real power of
Analyze Particleslies in its ability to generate a comprehensive data table. Before running it, navigate toAnalyze > Set Measurements...to customize which metrics you want to collect. This simple step ensures you get precisely the data you need for your research questions.
Customizing Your Data Output
The Set Measurements window is your command center for deciding what to measure. The parameters you pick here should be driven entirely by your scientific questions. Some of the most common and useful measurements include:
- Area: The total number of pixels inside your ROI.
- Mean Gray Value: The average pixel intensity within the object—essential for quantifying things like protein expression from fluorescence.
- Perimeter: The length of the boundary around the ROI.
- Shape Descriptors: Metrics like circularity, aspect ratio, and roundness that put a number to an object's form.
The following table breaks down some of the key measurements available in the Analyze Particles tool and explains what they can tell you in a practical, biological context.
Key Measurements from Analyze Particles
| Measurement Parameter | Description | Common Use Case |
|---|---|---|
| Area | The total number of pixels contained within the ROI. | Measuring the size of cells, nuclei, or lesions. |
| Mean Gray Value | The average pixel intensity of all pixels inside the ROI. | Quantifying fluorescence intensity to measure protein expression levels. |
| Circularity | A shape metric from 0.0 (line) to 1.0 (perfect circle). | Differentiating between round cells (e.g., lymphocytes) and elongated cells (e.g., fibroblasts). |
| Aspect Ratio | The ratio of the object's major axis to its minor axis. | Assessing cell elongation or the orientation of structures within a tissue. |
| Perim. (Perimeter) | The length of the boundary of the ROI. | Analyzing cell membrane complexity or irregularity. |
| Roundness | Another shape metric related to circularity (4*Area / (π*Major_Axis²)). | Identifying well-defined, rounded objects like vesicles or condensed nuclei. |
Understanding these parameters allows you to move beyond simple counts and start asking more sophisticated questions about the morphology and intensity of the objects in your images.
Once you’ve picked your measurements and configured your filters in Analyze Particles, running the tool will generate a "Results" table. Every row in this table represents a single object you segmented, and each column holds the specific data you asked for.
This table is your final product. You can easily save it by navigating to File > Save As... and selecting the CSV format. This makes it simple to import your data into statistical software like R, Python, or GraphPad Prism for graphing and deeper analysis. As a final tip, the "Show" dropdown in Analyze Particles lets you create visual overlays, which are perfect for generating figures for papers and presentations.
Got Questions About ImageJ Segmentation?
As you start working with ImageJ, some common questions and roadblocks are bound to pop up. It happens to everyone. Let's tackle a few of the most frequent ones I see, so you can get past the snags and back to your analysis.
Think of this as your go-to FAQ for when you get stuck. Getting these concepts straight is the key to pulling clean, reliable data from your images.
Can ImageJ Handle 3D Image Segmentation?
Yes, it absolutely can, and this is where Fiji (the "batteries-included" version of ImageJ) really shines. While we've focused on 2D images here, Fiji is incredibly capable when it comes to segmenting 3D volumes. You'll be working with image stacks—essentially a series of 2D slices stacked on top of each other—but the core ideas are the same.
You can still use basic tools like thresholding, but now you'll apply them to the entire stack at once to create a 3D object mask. For anything more complex, you'll want to lean on some specialized plugins that are built for this kind of work.
- 3D OC Suite: A go-to plugin for counting and measuring objects in three dimensions.
- MorphoLibJ: This one is a powerhouse, offering a deep library of 3D morphological filters and other advanced analysis tools.
Just a heads-up: working with 3D data is a lot more demanding on your machine. Be prepared for longer processing times and higher memory usage, as you're crunching significantly more data.
Distinguishing Segmentation from Classification
It’s really common to get these two terms confused, but they refer to completely different stages of an analysis pipeline. Nailing down the difference is crucial for setting up your workflow correctly.
Segmentation is all about drawing the lines. Its only job is to partition the image, separating your objects of interest (like cells or nuclei) from the background and from each other. The result is a collection of pixels that defines a shape, which ImageJ calls a Region of Interest (ROI).
Classification, on the other hand, is about giving things a name. This can be as broad as labeling an entire image (e.g., "cancerous" vs. "healthy") or as specific as labeling the objects you just segmented (e.g., "neuron" vs. "glia"). Classification always comes after segmentation.
In short: Segmentation asks, "Where are the objects?" Classification asks, "What are these objects?"
Troubleshooting Failed Automated Thresholding
So, you hit the auto-threshold button and the result is… a total mess. It's a classic image segmentation ImageJ headache. Before you give up and start tracing everything by hand, take a breath. The problem usually isn't the algorithm itself but the quality of the image you're giving it.
Most of the time, a failed threshold is caused by one of two things: uneven background illumination or a lot of image noise. Thankfully, ImageJ has tools to fix both.
Before you even think about thresholding, try running Process > Subtract Background.... This handy tool uses a "rolling ball" algorithm to find and remove those smooth background gradients, giving you a much flatter, more evenly lit image.
If noise is your enemy, a light touch of Process > Filters > Gaussian Blur... with a small radius (think 1 or 2) can smooth out the pixel-to-pixel variations just enough to help the thresholding algorithm see the bigger picture. If even that doesn't work, your image might be a candidate for a local thresholding plugin, which smartly calculates different thresholds for different regions of the image.
At PYCAD, we turn complex medical imaging problems into practical AI solutions. If you need to build advanced segmentation and analysis capabilities for your medical devices or research platforms, we've got the expertise to make it happen. Find out how we can help you at https://pycad.co.