Calculating a tumour's volume means figuring out the three-dimensional space it takes up, usually by looking at medical scans like CTs or MRIs. It gives us a much more precise measure of the tumour's true size and how it's reacting to treatment, far more so than the old-school, one-dimensional measurements. This 3D assessment is a cornerstone of modern oncology and critical for making the right clinical calls.
Why Accurate Tumour Volume Is a Game Changer in Oncology
For years, the standard way to measure a tumour's size in oncology was with simple line measurements. We’ve all relied on methods like RECIST (Response Evaluation Criteria in Solid Tumors), which just involves measuring the longest diameter of a lesion. It's quick and standardized, sure, but it often misses the full story of a tumour's growth or shrinkage, especially when you're dealing with irregularly shaped masses.
Think about a tumour that grows more like a sea star than a perfect sphere. Its longest diameter might not change much, but its actual volume—the real measure of its burden on the patient—could be expanding dramatically. This is exactly where you see the clinical power of mastering tumour volume calculation. You stop looking at a single line and start seeing the disease in a complete, 3D context.
The Limits of 1D and 2D Metrics
Relying on traditional metrics can be flat-out misleading. A treatment might cause a tumour to become less dense or change its shape without actually affecting its longest dimension. A 1D measurement would miss that nuance entirely, potentially leading to a delayed or incorrect assessment of whether a treatment is even working.
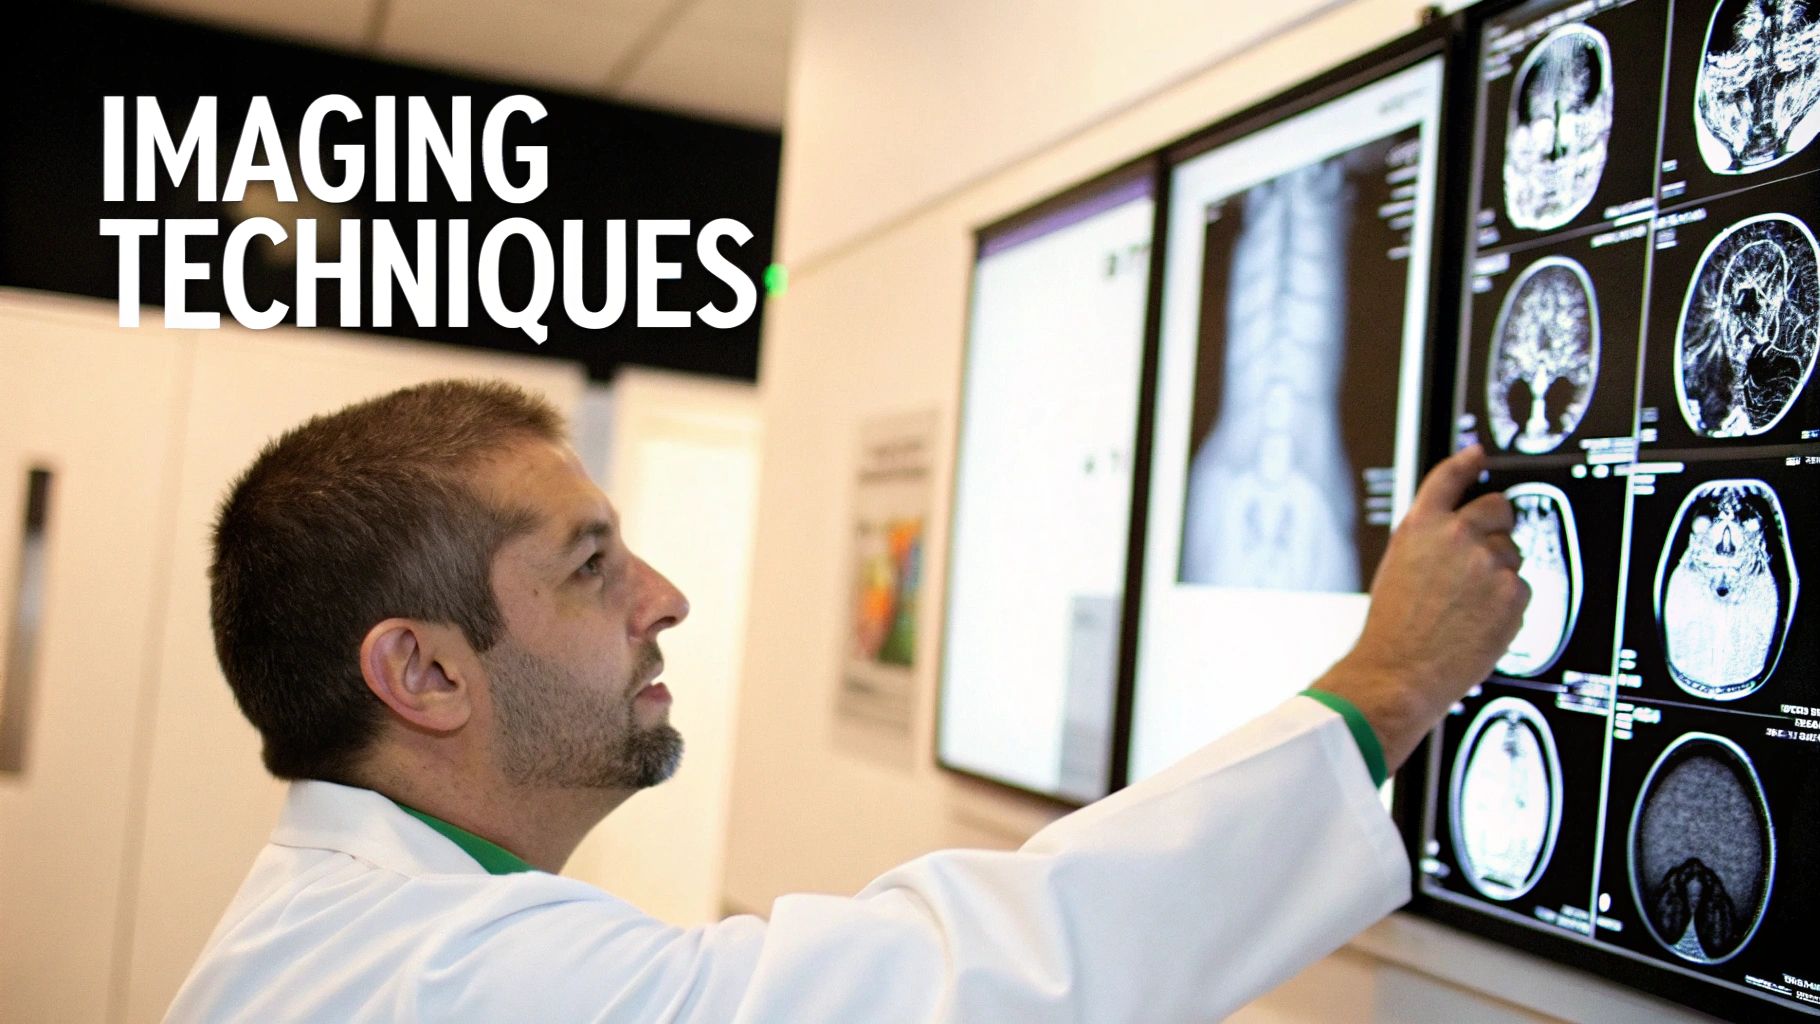
This image from the National Cancer Institute shows how RECIST is applied by measuring the longest diameter of target lesions.
It perfectly illustrates the simplicity of the RECIST method, but it also shines a light on its major drawback: it boils down a complex, three-dimensional structure to a single line.
Gaining Deeper Insights with 3D Assessments
Volumetric analysis gives you a much clearer picture of what’s really going on inside the patient. By calculating the total volume, clinicians can spot subtle changes in tumour size far earlier and with much more confidence. This kind of detailed data is absolutely essential for:
- Evaluating True Therapy Response: Knowing for certain if a tumour is shrinking, stable, or growing.
- Guiding Personalized Medicine: Adjusting treatments based on precise shifts in the tumour burden.
- Improving Clinical Trial Outcomes: Supplying more reliable data to assess how well new drugs are performing.
The move toward volumetric measurement isn't just about getting better numbers. It's about making smarter, more informed decisions that directly affect patient care. A more accurate measurement lets you pivot your treatment strategy faster if a therapy isn't delivering the results you expect.
Research has repeatedly shown that volumetric calculations can pick up on significant responses that simpler methods completely overlook. For example, one important study found that in patients with specific EGFR mutations, the median volumetric change was an incredible -45.9%. Unidimensional methods, in contrast, only showed a change of -11.1%. That's a huge difference.
This really drives home how volume calculations can reveal the true impact of targeted therapies. You can read the full research about these findings on PMC. It's this level of precision that makes tumour volume calculation a genuine game changer in the field.
When You Can't Rely on Software: The Manual Calculation Toolkit
Advanced software is great, but what happens when you don't have it? Sometimes you’re working with basic caliper measurements from a preclinical study or just have access to a simple image viewer. In these cases, falling back on manual formulas is essential for getting a reliable tumour volume calculation.
These tried-and-true methods are foundational in oncology and still incredibly valuable for a quick, practical estimate of tumour burden.
The go-to approach is almost always the modified ellipsoid formula. It’s a beautifully simple equation that treats the tumour like a prolate spheroid—think of it as a sphere that’s been stretched out along one axis.
Getting to Grips with the Modified Ellipsoid Formula
The formula itself is straightforward: Volume = 0.5 × Length × (Width)².
In this equation, 'Length' is the longest diameter you can measure, and 'Width' is the shortest diameter, taken at a right angle (perpendicular) to the length. This formula is a true workhorse in research, especially for preclinical animal models where tumours are measured right on the surface with calipers.
You might be wondering, where does that 0.5 come from? It's a clever simplification. The proper formula for an ellipsoid's volume is (π/6) × Length × Width × Height. Since π (pi) is roughly 3.14159, π/6 works out to about 0.5236. For everyday use, rounding that down to 0.5 makes the math much, much easier.
This simplification makes manual calculations faster and more consistent. You accept a tiny trade-off in absolute accuracy for a massive gain in practicality. It’s an elegant solution for making assessments on the fly.
A Practical Walkthrough
Let’s put this into practice. Imagine you're measuring a subcutaneous tumour on a mouse with a pair of digital calipers. You find the longest axis is 15 mm. Rotating the calipers 90 degrees, you measure the shortest axis and get 10 mm.
Here's how you'd plug those numbers in:
- Length: 15 mm
- Width: 10 mm
- Calculation: Volume = 0.5 × 15 mm × (10 mm)²
- Step-by-step: Volume = 0.5 × 15 × 100 = 7.5 × 100
- Result: 750 mm³
Just like that, you have a solid, actionable volume measurement. This same logic applies if you're measuring dimensions from a 2D image slice in a basic DICOM viewer that doesn’t have built-in volumetric tools.
Comparison of Common Tumour Volume Formulas
While the modified ellipsoid formula is the most common for manual calculations, it's helpful to see how it stacks up against other methods you might encounter. Each has its own assumptions and is best suited for different situations.
| Formula Name | Mathematical Formula | Key Assumption | Best Used For |
|---|---|---|---|
| Modified Ellipsoid | V = 0.5 × L × W² | Tumour is a prolate spheroid (egg-shaped). | Quick estimates from 2D images or caliper measurements; standard in preclinical studies. |
| Full Ellipsoid | V = (π/6) × L × W × H | Tumour is a perfect ellipsoid with three distinct axes. | 3D imaging where a third dimension (Height/Depth) is reliably measured. |
| Sphere | V = (4/3) × π × r³ | Tumour is perfectly spherical. | Tumours that are nearly round; less common as most tumours are asymmetrical. |
| Isotropic Formula | V = 0.5 × (mean diameter)³ | Tumour is roughly spherical, simplifies measurement. | Very rapid estimations when precision is less critical. |
These formulas highlight the trade-offs between simplicity and accuracy. The modified ellipsoid formula strikes a great balance, which explains its widespread adoption.
Be Aware of the Limitations
It's just as important to know when this formula doesn't work well. The modified ellipsoid method shines when a tumour is fairly symmetrical—like a sphere or an egg. The reality is, many tumours don't play by those rules.
Keep these limitations in mind:
- Irregular Shapes: If a tumour is lobulated, infiltrative, or has a bizarre, non-ellipsoidal shape, the formula's accuracy drops significantly. The more complex the geometry, the less reliable the estimate.
- Internal Necrosis or Cysts: Manual formulas see the tumour as one solid object. They can't distinguish between active tissue and internal features like necrotic (dead) cores or cystic (fluid-filled) areas.
- Measurement Variability: The final volume is extremely sensitive to your initial measurements. A tiny slip of the calipers or a slight difference in where you click on an image can snowball into a major variation in the result.
Even with these drawbacks, manual calculation is a critical skill. It gives you a solid baseline for comparison, works perfectly for tracking relative growth over time, and serves as a fantastic "sanity check" even when you do have access to sophisticated software. It’s the foundational tool that ensures you can always generate a meaningful measurement, no matter the circumstances.
Using Software for High-Precision Volumetric Analysis
While simple formulas give you a ballpark figure, the real gold standard for calculating tumour volume today is specialized medical imaging software. These platforms go way beyond rough estimates. They let you perform a precise, voxel-by-voxel analysis directly from medical scans like CTs or MRIs, unlocking a level of detail that’s crucial for both advanced clinical research and personalized patient care.
At the heart of this process is segmentation. Think of it as digitally tracing the tumour's outline on every single slice of the scan. Once the tumour is fully mapped out across all relevant slices, the software reconstructs these 2D drawings into a 3D model and calculates its exact volume. This is often called "voxel counting" because the software is literally summing up the volume of all the tiny 3D pixels (voxels) that make up the tumour.
The Classic Approach: Manual Segmentation
Manual segmentation is the original technique and, in many ways, still the benchmark for accuracy. It requires a trained expert—a radiologist, oncologist, or researcher—to meticulously trace the tumour’s boundary on every slice where it appears.
It’s definitely time-consuming. But this hands-on method allows an expert to apply their deep anatomical knowledge to distinguish the tumour from surrounding healthy tissue, which is especially important when the edges are fuzzy or the tumour is tangled with other structures. It gives you an incredible degree of control, which is why it’s often the mandatory method for clinical trials where precision is non-negotiable.
Here’s a look at the interface of a popular open-source platform, 3D Slicer, that's used for this kind of work.

This kind of multi-panel view is exactly what clinicians use. It lets them navigate through the different anatomical planes (axial, sagittal, and coronal) as they build the 3D model of the tumour.
The Rise of AI-Assisted Segmentation
The big catch with manual segmentation? It's slow and prone to what we call "inter-observer variability"—two different experts might trace the same tumour slightly differently. This is where AI-assisted methods have completely changed the game. Modern software now comes equipped with artificial intelligence algorithms that can automatically identify and segment tumours with incredible speed and consistency.
These tools are trained on huge datasets of medical images that have already been annotated by experts. The result is an algorithm that can do the tedious work of segmentation in minutes, not hours.
This brings some massive advantages to the table:
- Speed: It radically cuts down the time it takes to get a final tumour volume.
- Consistency: AI minimizes the human variability factor, making measurements far more reproducible over time and between different users.
- Efficiency: It frees up experts from the grind of manual tracing so they can focus on what they do best: reviewing, validating, and interpreting the results.
AI doesn't replace the expert; it acts as a powerful assistant. The most effective workflow today is a hybrid one: an AI model does the initial segmentation, and then a human expert quickly reviews and refines it to ensure clinical accuracy.
This blend of automated speed and human oversight is the best of both worlds. The shift toward these computational methods is also opening up new doors in oncology. For example, by analyzing repeated tumour volume measurements, sophisticated modeling can now offer a much more granular look at treatment effectiveness and tumour growth dynamics. You can see how advanced regression models are being applied in practice in this detailed study on patient-derived xenograft models.
Popular Software Tools You Should Know
Diving into the world of medical imaging software can feel overwhelming, but a few key platforms have emerged as industry standards. Two of the most respected and widely used open-source options are 3D Slicer and ITK-SNAP. Each has its own particular strengths.
Let's break them down.
| Feature | 3D Slicer | ITK-SNAP |
|---|---|---|
| Primary Strength | A powerful, extensible platform with a huge library of modules for analysis, registration, and visualization. | Highly optimized for segmentation tasks with a very intuitive and user-friendly interface. |
| Learning Curve | Steeper. Its vast capabilities mean there's more to learn upfront. | Gentler. It's a fantastic starting point if you're new to segmentation. |
| AI Integration | Excellent support for AI models through extensions like MONAI Label for state-of-the-art automated segmentation. | Offers great semi-automatic tools but has traditionally been less focused on deep learning integration. |
| Best For | Complex research projects that need more than just segmentation, like fusing different types of images or biomechanical modeling. | Focused, high-quality manual and semi-automatic segmentation where you need to be fast and efficient. |
Ultimately, the choice comes down to your project's specific needs. If all you need is a straightforward tumour volume, the focused toolset of ITK-SNAP is incredibly efficient. But if your work involves more complex analyses or you want to integrate custom AI models, the power and flexibility of 3D Slicer are unmatched.
Your Workflow for Tumour Segmentation and Calculation
Theory and formulas are great, but everything changes when you’re staring at a fresh set of scans. Let's move from the abstract to a practical, step-by-step workflow you can use for your next tumour volume calculation. This is your road map, from the moment you load the scan to the final, reproducible measurement.
The whole process kicks off with your data, which is usually a folder full of DICOM files from a CT or MRI. These aren't just images; they're packed with crucial information, especially the slice thickness, which is non-negotiable for an accurate 3D reconstruction. Your first move is to get this series loaded into a solid medical image viewer.
For this walkthrough, we’ll imagine we're using an open-source workhorse like 3D Slicer. When you load a DICOM series, the software stacks the 2D slices into a 3D volume, giving you the axial (top-down), sagittal (side), and coronal (front) views. Just getting oriented is the first critical step.
Navigating the Image and Choosing Your Tools
Once the image is up, spend a minute scrolling through the slices. In the axial view, find the very first slice where the tumour appears and follow it all the way to the last. This initial fly-through gives you a mental map of the tumour’s size, shape, and how it sits next to other anatomical structures.
With a good feel for the target, it's time to pick your segmentation tool. Modern software gives you a whole toolkit, and each one has its place.
- Manual Painting: The classic approach. You literally use a digital brush to trace the tumour on every single slice. It gives you complete control but, be warned, it can be a real time-sink.
- Thresholding: This tool is your friend when a tumour is much brighter or darker than its surroundings, like a lesion lit up with contrast. You just set an intensity range, and it grabs all the corresponding pixels.
- Region Growing: Here, you drop a "seed" point inside the tumour. The algorithm then expands outwards, grabbing all connected pixels of a similar intensity until it hits a boundary. It's fantastic for well-defined masses.
- AI-Powered Brushes: This is where things get interesting. You make a few rough scribbles inside and outside the tumour, and the AI predicts the full boundary. It’s a great mix of automated speed and human oversight.
Honestly, the tool you choose comes down to the image quality and the tumour itself. A perfectly round, homogenous tumour? Thresholding might take you 30 seconds. A messy, infiltrative mass with fuzzy edges? You'll probably be relying on careful manual painting or a smart AI assistant.
Handling Tricky Scenarios in Segmentation
Let’s be real: medical images are rarely textbook-perfect. You’re going to run into challenges that demand good judgment and, most importantly, a consistent approach to keep your measurements reliable.
One of the biggest headaches is a poorly defined tumour boundary. When the edge between the tumour and healthy tissue is blurry, you have to make a call. Do you trace the faint, outermost signal, or do you play it safe with a more conservative line? The most important thing here is consistency. Whatever rule you set for yourself, stick with it across every slice and every scan for that patient.
Another common problem is a necrotic core—that dead area in the middle of a tumour that doesn't soak up contrast. Deciding whether to include this in your final volume is a major decision.
In studies tracking how well a therapy is working, the focus is almost always on the viable tumour tissue. The standard protocol in these cases is to segment the entire lesion first, then segment the necrotic core as a separate piece. Finally, you subtract the necrotic volume from the total. This gives you a much better measure of the active disease.
Documenting these little decisions is what elevates a decent measurement to a rock-solid one. Write down your protocol so that you—or a colleague—can replicate it perfectly six months down the line.
This infographic lays out the basic concept of turning simple linear measurements into a volume, which is really the core idea behind all these calculations, whether done by hand or with software.
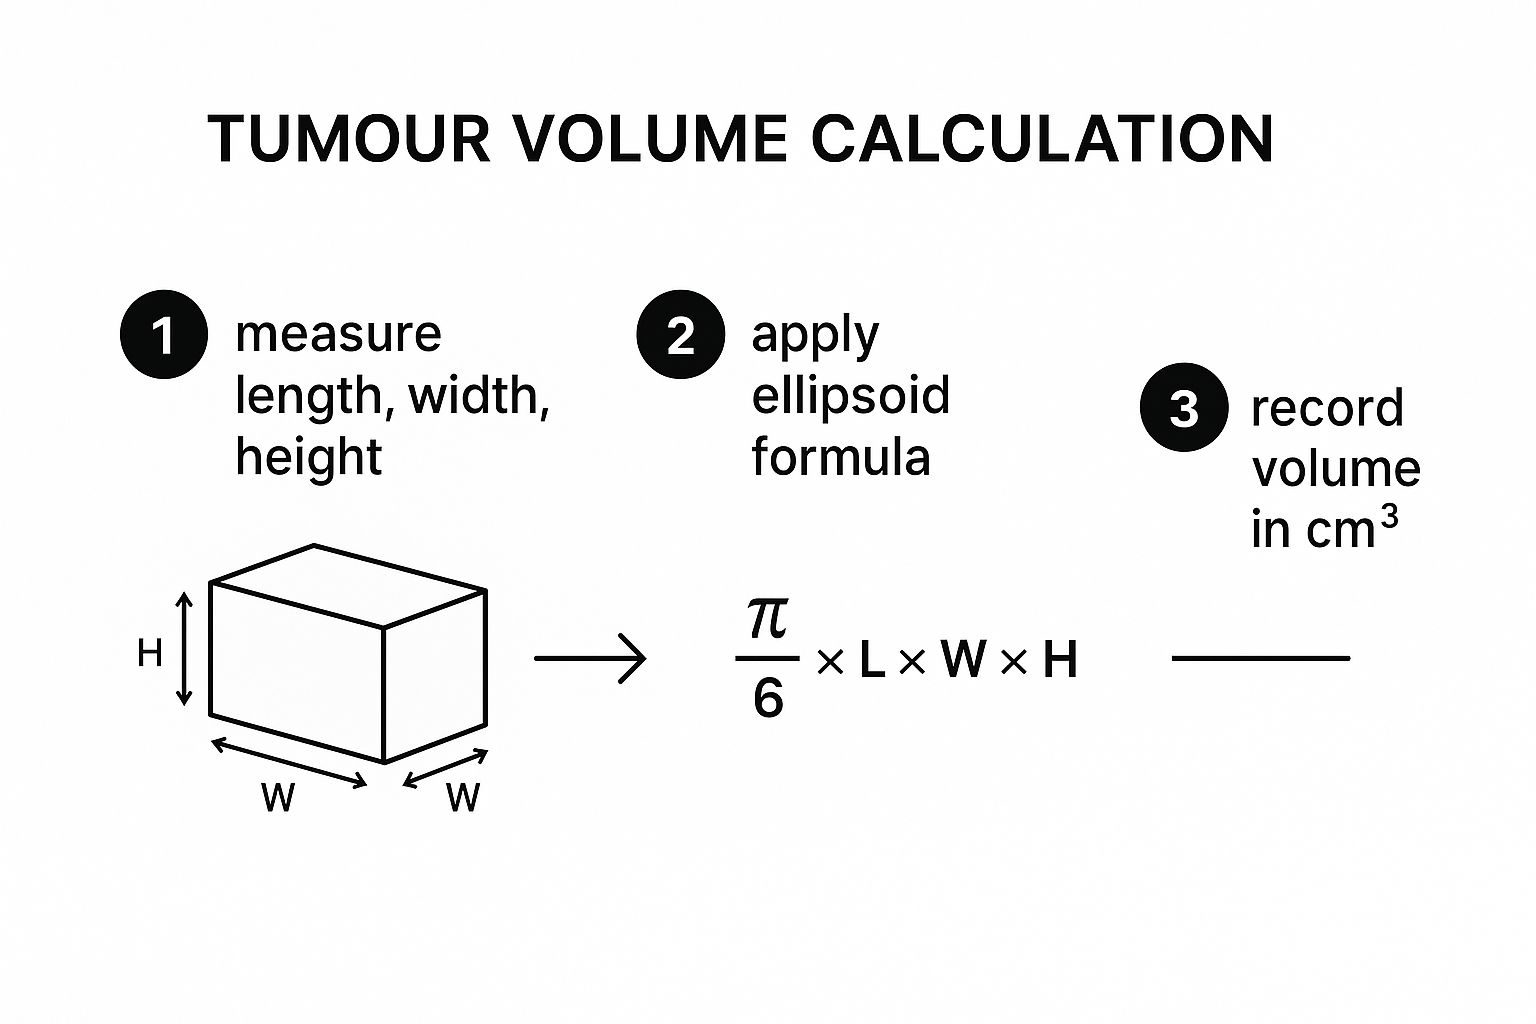
As you can see, the process boils down to taking a few key measurements and plugging them into a standard formula to get a volumetric estimate.
From 3D Model to Final Volume
As you finish segmenting each 2D slice, the software is busy in the background, stacking them up to build a 3D model of the tumour. This is the best part—seeing your meticulous tracing turn into a tangible, 3D object you can spin around and examine from all angles.
With the 3D model complete, the software does the final math. It counts every single voxel (a 3D pixel) inside your segmented model and multiplies that number by the known volume of a single voxel. The result is a highly precise volume, usually given in cubic millimeters (mm³) or cubic centimeters (cm³).
Here’s a quick rundown of the final steps inside the software:
- Review the 3D Model: Always give the 3D model a final once-over. Look for weird spikes, holes, or floaters that signal a mistake on one of your slices.
- Run the Volumetrics Module: Find the measurement or label statistics tool in your software. This feature is built to analyze your segmented region.
- Extract the Volume: The tool will spit out a table of numbers. You’re looking for the total voxel count and, most importantly, the final calculated volume.
- Export Your Results: Log this number carefully. Best practice is to export the segmentation file itself (often a .nrrd or .nii file) right alongside the numeric result. This creates a bulletproof, auditable record of your work.
Following this workflow—from loading the DICOMs to exporting the final number—ensures your tumour volume calculation is more than just a measurement. It becomes a robust, reproducible piece of data you can confidently use for clinical decisions or research.
Common Pitfalls and How to Avoid Them
Even with the best software and a solid workflow, the devil is in the details when it comes to getting an accurate tumour volume calculation. A precise, reproducible number isn’t just about clicking the right buttons; it's about anticipating and sidestepping the common issues that can derail your data. Consider this your troubleshooting guide, built on hard-won experience.
One of the most frequent yet overlooked errors is inconsistency in imaging protocols. If a patient's baseline CT scan has a slice thickness of 5 mm, but their follow-up scan uses 2.5 mm slices, you're no longer comparing apples to apples. The thinner slices give you a much higher-resolution view, which can subtly change how you perceive and measure tumour boundaries, introducing artificial changes in volume.
This is exactly why having a clear, documented plan is non-negotiable for any serious research or clinical tracking.
The Challenge of Inconsistent Segmentation
The single biggest source of error in volumetric analysis is, without a doubt, inter-observer variability. This is the subtle, natural difference in how two highly trained experts might trace the same tumour. One person might be more inclusive of a blurry edge, while another takes a more conservative line. Neither is "wrong," but the resulting volumes can differ significantly.
This variability becomes a major headache with certain types of tumours:
- Infiltrative Tumours: Lesions without a clear, defined border that instead weave into surrounding healthy tissue are notoriously tricky to segment consistently.
- Complex Geometries: Tumours that are lobulated, oddly shaped, or wrapped around critical structures like blood vessels present a huge segmentation challenge.
- Post-Treatment Changes: After radiation or chemotherapy, the area around a tumour can become inflamed. This inflammation can light up on a scan and be easily mistaken for tumour growth—a phenomenon known as pseudoprogression.
To fight this, establishing a Standard Operating Procedure (SOP) is absolutely essential. An SOP isn't just a document; it's your team's agreement on how to handle these ambiguous situations. It needs to define clear rules for boundary definition, how to manage necrotic cores, and what imaging parameters are required for any analysis.
The real goal of an SOP is to make the tumour volume calculation as objective as possible. It ensures that when you see a volume change over time, you can be confident it reflects a true biological change, not just a difference in measurement technique.
Accounting for Treatment-Related Effects
Knowing how to distinguish between true tumour progression and treatment-related inflammation is a critical skill. An inexperienced observer might see an increased enhanced area on a post-treatment MRI and immediately flag it as growth. A seasoned clinician, on the other hand, knows to look for other clues and consider the timing of the scan relative to the therapy.
This is where volumetric measurements really show their power over simple diameter-based assessments. For instance, a 2017 study on papillary thyroid cancers found that volume was a more sensitive way to track tumour changes than diameter alone. A tumour growing from 0.3 to 0.5 mL in volume corresponded to a diameter increase from 10 to 13 mm. This shows how volume can capture nuanced progression that might otherwise be missed. You can learn more about these important findings in the original study.
Building a Bulletproof Protocol
To produce data you can truly trust, your focus must be on minimizing variability at every single step. This means going beyond just having an SOP and building a culture of consistency within your team.
Here are some actionable tips to build directly into your protocol:
- Standardize Image Acquisition: Insist on using the exact same imaging modality (CT vs. MRI), contrast protocol, and slice thickness for all scans of a single patient over time. No exceptions.
- Conduct Training and Calibration: Before starting a major project, have multiple readers segment the same set of diverse cases. Get in a room, discuss the discrepancies, and come to a consensus to align your approaches.
- Use a Single Reader for Longitudinal Cases: Whenever possible, the same person who segmented the baseline scan should be the one to segment all follow-up scans for that patient. This is the single most effective way to eliminate inter-observer variability.
- Document Every Decision: If you run into a particularly ambiguous case, take a screenshot and write a brief note explaining why you made a specific segmentation choice. This audit trail is invaluable for later review.
By proactively addressing these common pitfalls, you transform tumour volume calculation from a subjective art into a rigorous, reproducible science. It's this level of precision that makes the data powerful enough to guide critical treatment decisions and drive meaningful research forward.
Common Questions About Measuring Tumour Volume
Even with the best workflow, calculating tumour volume is rarely straightforward. You'll inevitably run into "what if" scenarios in the clinic or during research. How you handle these tricky situations is what separates good data from great data.
The questions I hear most often involve unusual tumour shapes and the nitty-gritty differences between imaging techniques. Having a clear plan for these common hurdles is key to keeping your measurements consistent and meaningful.
How Should I Handle Hollow or Necrotic Tumours?
This is a big one. When you see a tumour with a necrotic (dead tissue) or cystic (fluid-filled) center, you have a choice to make: do you include that non-viable area in your total volume? The answer really comes down to what you’re trying to measure.
If you're assessing how a tumour responds to therapy targeting active cancer cells, the gold standard is to measure only the viable tumour volume. This means you're focusing on segmenting the solid, living parts of the tumour.
To do this properly:
- First, segment the entire outer boundary of the tumour to get the total volume.
- Then, create a separate segmentation for the hollow or dead region inside.
- Finally, subtract the necrotic/cystic volume from the total volume.
This two-step process gives you a much clearer picture of the active disease. The most important rule here is consistency. Whatever method you choose, you have to stick with it for every single measurement on that patient over time.
What’s the Difference Between RECIST and Volumetric Measurement?
It's a fundamental distinction. RECIST (Response Evaluation Criteria in Solid Tumors) is a standardized system that relies on a single measurement: the longest diameter of a tumour. It's a one-dimensional (1D) approach that makes tracking simpler but can be misleading for tumours that aren't perfect spheres.
Volumetric measurement, on the other hand, quantifies the entire three-dimensional space a tumour occupies. This 3D approach is far more sensitive to subtle changes in size, shape, and even density, offering a more complete picture of the tumour burden.
While RECIST is still a staple in clinical trials because of its simplicity and long history, most experts agree that volumetric analysis is the more precise and informative method. It often picks up on tumour changes earlier and more reliably than 1D metrics can.
Which Imaging Is Better for Volume Calculation: MRI or CT?
The best choice between an MRI (Magnetic Resonance Imaging) and a CT (Computed Tomography) scan really depends on the type of tumour and where it is in the body. There’s no single right answer.
MRI usually provides superior soft-tissue contrast, which is a huge advantage for clearly defining tumour edges in places like the brain, liver, and prostate. CT scans are generally faster, more widely available, and are often the go-to for tumours in the lung and abdomen.
Here's the most critical takeaway: use the same imaging modality for all scans on a single patient. If you start with a CT at baseline and switch to an MRI at follow-up, you introduce too much variability. Comparing the volumes becomes nearly impossible.
At PYCAD, we build AI-powered solutions that bring a new level of precision and efficiency to medical imaging analysis. We specialize in data handling, model training, and deployment to help research teams and clinicians get the most accurate tumour segmentation and volume calculations possible. See how we can support your medical imaging projects by visiting us at https://pycad.co.
Keep Reading
Related Articles
Explore the full Quantitative Imaging HubAll services, tools, and guides on this topic — in one place.
Visit Hub →