Figuring out the exact size of a tumor is a fundamental part of cancer care. We're not just talking about a simple length measurement; we're talking about calculating its full, three-dimensional volume from medical images like CT or MRI scans.
Why We Need to Measure in 3D
For a long time, the standard approach was to measure a tumor’s longest diameter. It's straightforward, but it's also a bit like describing an entire building by only measuring its height. This one-dimensional metric can be seriously misleading, especially for tumors with irregular shapes. It just doesn't capture the whole story.
Volumetric analysis, on the other hand, gives us a much more precise representation of a tumor's true size and, more importantly, how it's changing. This level of accuracy is absolutely critical for making the right clinical calls.
Moving Beyond Simple Length Measurements
Think about it this way: measuring the longest side of a potato tells you a little, but it doesn't really tell you how big the potato is. A tumor is the same. It can shrink in one direction while expanding in another, a subtle change that a simple diameter measurement, like those used in the RECIST criteria, would completely miss.
This is exactly why the field is moving towards tumor volume calculation. By evaluating the entire mass, we get a far more sensitive and reliable picture of whether a treatment is truly effective.
A change in volume provides a direct, quantifiable measure of tumor response. It helps answer the critical question: "Is this therapy actually working?" This shift from a linear to a volumetric perspective is fundamental to modern, personalized oncology.
For example, I've seen cases where a targeted therapy causes a tumor to become less dense or even hollow out internally before its overall diameter starts to shrink. A volumetric measurement picks up on this internal change right away, signaling a positive response much earlier than a 1D measurement ever could. Getting that early insight is invaluable for fine-tuning treatment plans and improving a patient's chances.
The Impact on Clinical Surveillance and Research
Precise tumor volume calculation isn't just about tracking shrinkage; it’s also about spotting subtle growth that might otherwise fly under the radar. This is especially crucial in active surveillance, where we monitor slow-growing cancers without jumping into immediate, aggressive treatment.
Tumor growth isn't always a simple, linear process. A fascinating study on papillary thyroid cancer, for example, found that while very few tumors showed significant growth in diameter, a volumetric analysis revealed that some were actually growing exponentially. By tracking tumor volume doubling times, the researchers got a much clearer view of the underlying biology. You can dive deeper into the study on tumor growth kinetics in this insightful paper.
This level of detail has huge implications for patient care and clinical trials.
For patients, it means:
- More precise monitoring: We can catch meaningful growth sooner.
- Better treatment decisions: We can confidently hold off on unnecessary treatments if the disease is stable.
- A clearer prognosis: Patients get a more accurate picture of what to expect.
For researchers running clinical trials, volumetric data ensures that the effectiveness of a new therapy is measured with the highest possible precision. This leads to stronger, more reliable results. At the end of the day, getting tumor volume calculation right is a cornerstone of advancing cancer care, giving us the clarity we need to make confident, life-altering decisions.
Mastering Manual and Caliper-Based Measurements
Long before we had sophisticated imaging software, the go-to tool for estimating tumor volume was the humble caliper. This manual method is still a cornerstone of preclinical research, especially when dealing with subcutaneous xenografts—those tumors grown just under the skin of a lab animal. Its simplicity and low cost make it a practical first-line approach for many labs.
The process itself sounds straightforward. You take a digital caliper, carefully measure the tumor's longest dimension (length), and then measure its shortest perpendicular dimension (width). With those two numbers, you can plug them into a formula to get a solid estimate of the volume.
Putting the Modified Ellipsoid Formula to Work
One of the most common equations you'll see for this is the modified ellipsoid formula: Volume = 0.5 x Length x Width². This formula treats the tumor as a prolate ellipsoid, which is basically a stretched-out sphere. For many subcutaneous tumors, this is a pretty fair assumption. The 0.5 is a handy simplification of the more precise π/6 (which is about 0.523) found in the standard formula.
Let’s walk through a real-world scenario. Imagine you're tracking tumor growth in a mouse model to see if a new drug is working.
- You measure the tumor's length and get 14 mm.
- You then measure the width, getting 8 mm.
Plugging these into the formula, the math looks like this: Volume = 0.5 x 14 mm x (8 mm)² = 0.5 x 14 x 64 = 448 mm³. This gives you a hard number, a quantitative data point you can use to track the tumor's response to treatment over time.
The Bottom Line: The caliper method is a fast, cost-effective way to estimate tumor volume. But remember, its accuracy hinges entirely on the assumption that the tumor has a regular, ellipsoid shape—and that’s not always the case in the real world.
Now, while the formula itself is simple, getting consistent and accurate measurements takes a bit of practice and a lot of attention to detail. Several factors can sneak in and introduce variability, potentially throwing off your study's results.
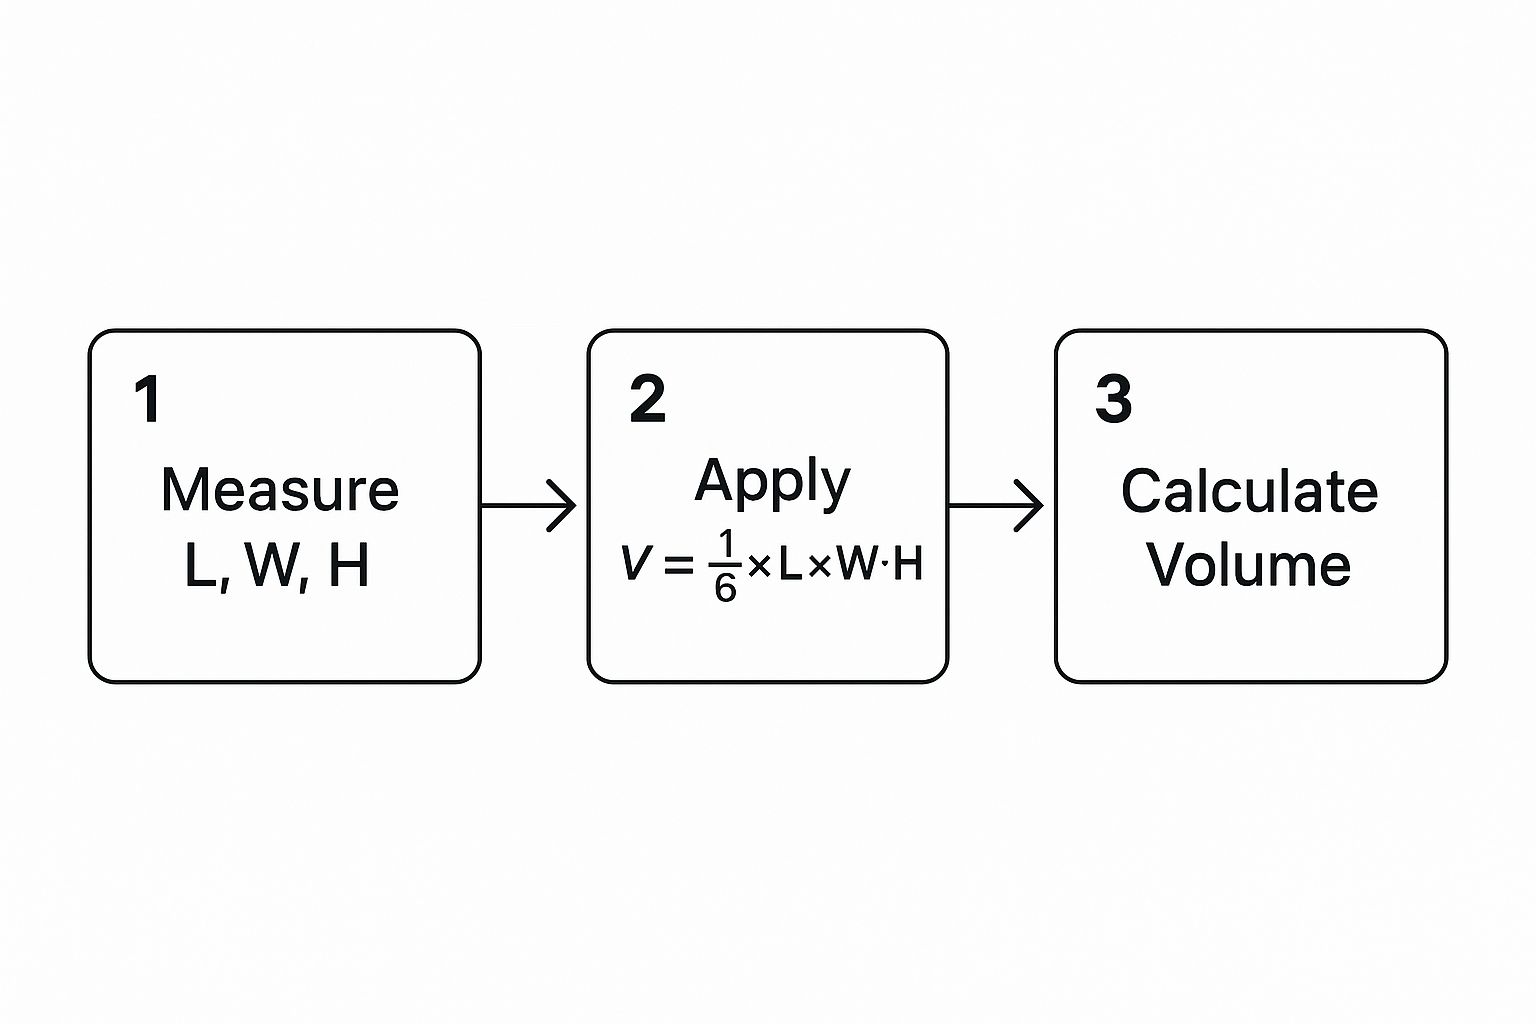
The image above gives a clean visual of how these linear measurements translate into a final volumetric output using a standard formula. It looks simple, but the devil is in the details.
Common Formulas for Ellipsoid Volume Estimation
While the modified ellipsoid formula is a workhorse, it's not the only one. Depending on the specific shape assumptions and available measurements, researchers might turn to other equations. Here’s a quick comparison of the most common ones.
| Formula Name | Equation | Common Use Case | Key Assumption |
|---|---|---|---|
| Modified Ellipsoid | V = 0.5 x L x W² |
Subcutaneous tumors in preclinical models. | Tumor is a prolate spheroid (length > width). |
| Standard Ellipsoid | V = (π/6) x L x W x H |
When a height/depth measurement is available and reliable. | Tumor is a true tri-axial ellipsoid. |
| Sphere | V = (4/3)πr³ |
Tumors that are nearly perfectly spherical. | The tumor is a sphere (L=W=H). |
| Isotropic (Tumorcode) | V = L x W x H x 0.5 |
Alternative to standard ellipsoid, often used in specific software. | Similar to the ellipsoid but uses a simplified constant. |
Each of these formulas comes with its own set of assumptions about the tumor's geometry. Choosing the right one—or at least being aware of the one you're using—is critical for consistency and for comparing your results to other studies.
Navigating Pitfalls and Inconsistencies
Even with the right formula, human error can easily creep in. Here are some of the most common challenges I've seen trip people up:
- Inconsistent Pressure: If you press too hard with the calipers, you can compress the soft tumor tissue and get a smaller-than-actual reading. Too little pressure, and you won't capture the full dimensions. The goal is a firm, consistent touch every single time.
- Choosing Measurement Points: Finding the exact longest and shortest axes isn't always obvious, especially on an irregularly shaped tumor. This is why it’s best practice to have the same person take the measurements throughout a study to reduce that inter-observer variability.
- Tumor Shape: This is the big one. The moment a tumor becomes ulcerated, lobulated, or just plain weirdly shaped, the formula’s core assumption of a perfect ellipsoid goes out the window. This can lead to major inaccuracies in your final tumor volume calculation.
Acknowledging the Inherent Limitations
At the end of the day, the caliper-based method is an estimation, not a direct measurement of volume. Its reliance on geometric assumptions means there will always be a degree of error, which can have significant downstream effects, especially when you're trying to determine if a treatment is effective.
We know that these measurements are skewed by how much a tumor's shape deviates from a perfect ellipsoid and by simple inconsistencies in measurement. Studies have shown that while measurement errors might be around 7% for smaller tumors, they can explode to as high as 27% for larger ones. This kind of discrepancy can mask or delay the detection of real, statistically significant differences between your treatment and control groups. In fact, caliper gauging alone can introduce up to an 18.4% error in volume estimation. You can dig deeper into these figures and learn more about caliper measurement accuracy from research on the topic.
When you absolutely need high precision—especially for internal tumors you can't physically touch or for those with highly irregular shapes—the limits of calipers become starkly clear. This is the point where image-based techniques are no longer just a nice-to-have; they become a necessity. While calipers remain invaluable for high-throughput preclinical screening, understanding their limitations is crucial for interpreting your data correctly and knowing when it’s time to level up to more precise methods.
Moving to Image-Based Volumetric Analysis
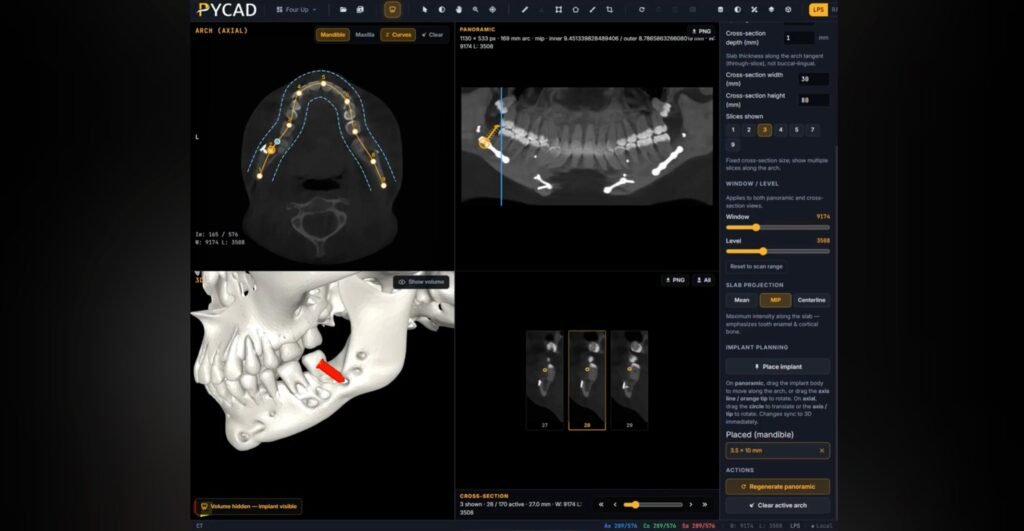
When physical calipers just can't give you the precision you need—especially for tumors deep inside the body or those with funky, irregular shapes—it's time to dive into the rich data of medical images. Shifting from manual measurements to image-based volumetric analysis is a massive leap forward in getting an accurate tumor volume calculation. This approach uses digital tools to go through scans like CTs and MRIs slice by slice, building a detailed 3D model of the tumor that physical tools could never dream of capturing.

This method isn’t just about getting a better number; it’s about finally seeing the tumor for what it really is. Instead of forcing it into a neat ellipsoid shape, we can account for every single contour, lobe, and pocket of necrosis. What you end up with is a true-to-life digital twin of the lesion.
The Core Workflow: Semi-Automated Segmentation
The process, which we often call semi-automated segmentation, is really a partnership between a clinician's expertise and the software's number-crunching power. While the specific software you use might differ—think platforms like 3D Slicer or Horos—the fundamental workflow is pretty much the same across the board.
It usually starts with loading the patient's scan (typically a DICOM series from a CT or MRI) into your analysis software. The first job, and where your clinical judgment is critical, is to find the tumor across all the image slices where it appears. You have to be able to tell it apart from healthy tissue, blood vessels, and everything else in the neighborhood.
Once you’ve locked onto it, you start delineating the region of interest (ROI). Using digital drawing tools, you manually trace the tumor's boundary on each slice. The software then does the heavy lifting, stacking these 2D outlines and calculating the total volume inside them.
By adding up the area of each contour and multiplying by the slice thickness, the software builds a 3D model. This "sum of areas" or "voxel counting" method gives you a direct volume measurement without any geometric guesswork. For tumors that aren't perfect spheres, this is a game-changer.
This technique transforms a stack of flat pictures into a measurable, three-dimensional object, giving you a precise tumor volume calculation that truly reflects the lesion’s complexity.
Practical Tips for Consistent Results
Getting accurate, repeatable segmentations takes more than just a steady hand. There are a handful of techniques and software features that can make a huge difference in both the quality of your work and how long it takes. Mastering these is really the key to reliable volumetric analysis.
Here are a few tips I've picked up over the years:
- Play with the Window and Level: Medical images have a huge range of grayscale values. By adjusting the "window" (the range of values you see) and "level" (the center of that range), you can make the contrast pop between the tumor and surrounding tissue. This makes the borders much clearer and easier to trace.
- Let Interpolation Do Some of the Work: Manually outlining a big tumor on every single slice is a marathon. Thankfully, most modern software has interpolation tools. You can trace the ROI on, say, every third or fifth slice, and the software will smartly fill in the contours on the slices in between. It's a massive time-saver.
- Stick to One Plane: Always work in the same anatomical plane (like axial, coronal, or sagittal) for the whole study. Hopping between planes can mess with your perception of the tumor's boundaries and lead to inconsistencies.
The Undeniable Edge Over Calipers
The superiority of image-based analysis is crystal clear when you're up against internal tumors or those with complex shapes. Caliper formulas are stuck on the assumption that every tumor is a simple, regular ellipsoid. When a tumor is lobulated, has dead spots inside, or is wrapped around other organs, those formulas can be off by 20% or more.
Think about a pancreatic tumor that's all tangled up with major blood vessels. You could never measure that with calipers. And even if you could, a simple length and width would completely misrepresent its true size. Image-based segmentation, on the other hand, lets you meticulously trace every intricate boundary, giving you a volume that reflects its actual, complicated anatomy. That kind of accuracy is absolutely critical for making smart decisions about treatment, where even small changes in tumor size can determine the next step for a patient.
Why Simple Formulas Don't Tell the Whole Story
In the lab and sometimes even in the clinic, it’s tempting to rely on a quick formula to estimate a tumor's size. You take a couple of diameter measurements, plug them into an equation, and you have your volume. Easy, right? The problem is, this shortcut often creates a major disconnect between the calculated number and the tumor’s actual, true volume.
The simple truth is that tumors aren't perfect spheres or neat little ellipsoids. They're messy, complex biological structures. They can be lumpy, asymmetrical, or have dead, necrotic tissue inside—all things that a simple length and width measurement just can't account for. When we lean on an idealized formula for something so irregular, we're bound to get it wrong.
The Overestimation Problem
Think about what happens when you use a standard formula, like the one for a modified ellipsoid, on an oddly shaped tumor. You're essentially wrapping a smooth, perfect shape around a lumpy, uneven object. Inevitably, you end up including a lot of empty space in your measurement. It's like trying to find the volume of a jagged rock by measuring the box it fits into; you’re measuring a ton of air along with the rock.
This isn't a minor rounding error, either. A telling study drove this point home, finding that the median measured tumor volume in their test group was 11,488.9 mm³. When they used a standard formula to calculate the volume of the same tumors, the number jumped to 17,148.6 mm³. That’s a huge, statistically significant difference, highlighting just how much these formulas can inflate the results. For a closer look at their methodology, you can dive into the full findings on volume calculation discrepancies in this detailed study.
This tendency to overestimate gets worse as tumors grow larger and more complex, which can seriously skew data and affect how we interpret a patient's condition.
Just How Far Off Are the Numbers?
When scientists want to see how well two different measurement methods line up, they often turn to a statistic called the concordance correlation coefficient (CCC). Think of it as a reliability score. A perfect 1.0 means the two methods agree completely, while a score near 0 means there’s virtually no agreement.
The concordance correlation coefficient (CCC) for tumor volume was found to be just 0.7022. This number confirms a fairly low level of agreement between formula-based calculations and direct volumetric measurements, reinforcing that one is a poor substitute for the other.
A CCC of 0.7022 is a long way from a perfect score. It’s the statistical proof behind what we see with our own eyes: the volume you get from a simple diameter measurement often doesn't match the reality you see when you meticulously outline a tumor, slice by slice.
The Real-World Impact on Patient Care
This measurement gap isn’t just an academic detail; it has very real consequences for patients. Overestimating tumor volume can lead to flawed decisions about whether a treatment is working, with direct impacts on patient care.
Let's imagine a few scenarios:
- Is the Treatment Working? If the initial volume was overestimated, a small but meaningful reduction in the tumor’s size could be missed entirely. The therapy might actually be effective, but the imprecise measurement makes it look like a failure, potentially causing a doctor to switch treatments unnecessarily.
- Is the Disease Stable? On the other hand, a tumor could be growing but also becoming more spherical. A caliper-based calculation might show the volume is stable or even shrinking. This can create a false sense of security, delaying a switch to a more aggressive therapy when it's needed most.
- Are the Clinical Trial Results Accurate? In research, where every detail matters, these inaccuracies can completely cloud the results. A promising new drug might look less effective than it truly is, simply because the measurement tool wasn't sensitive enough to capture the real changes.
At the end of the day, forcing a complex biological mass into a neat mathematical box has its limits. While formulas can be useful for a quick ballpark estimate, true precision in tumor volume calculation means moving toward methods that respect the tumor’s actual, irregular shape.
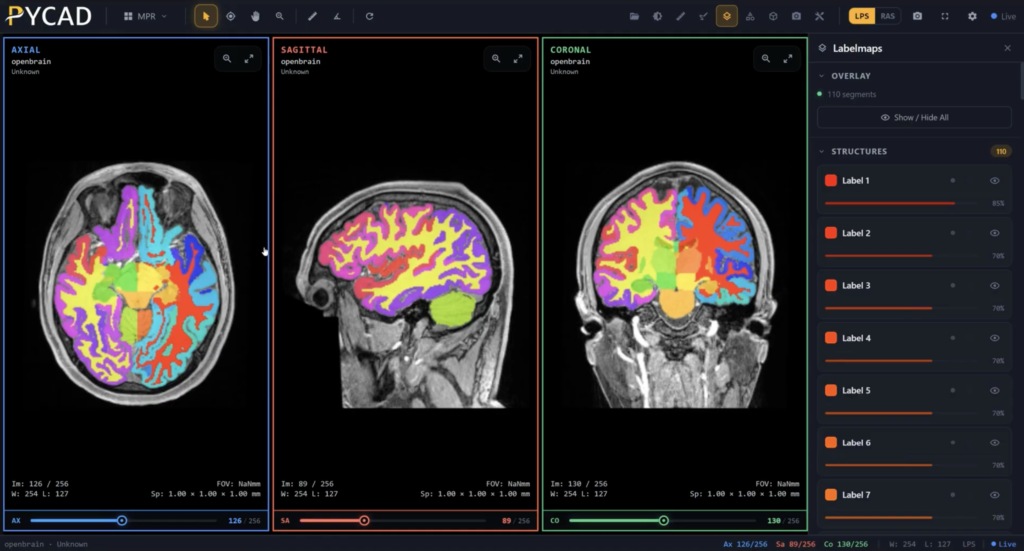
How AI Is Automating Tumor Segmentation
While manual and semi-automated methods give us a solid way to calculate tumor volume, they share a common bottleneck: they depend entirely on a human. The process is slow and, more critically, open to inconsistency. You could have two highly skilled radiologists outline the exact same tumor and get slightly different results—small variations that can lead to meaningful discrepancies in the final volume.
This is exactly where artificial intelligence is making its mark.
AI-driven segmentation is the next logical leap in volumetric analysis. Using sophisticated deep learning models, we can now train algorithms to find and draw tumor boundaries on medical scans with a speed and consistency a person just can't replicate. This isn't some far-off concept; it's a practical tool already finding its way into clinical workflows.
These systems are typically built on what are known as convolutional neural networks (CNNs), a type of AI that's incredibly good at spotting patterns in images. To train them, researchers feed the models thousands of annotated medical scans—CTs, MRIs, you name it—where experts have already traced the tumors. Through this massive training process, the AI learns to recognize the subtle textures, densities, and shapes that separate a tumor from healthy tissue.
The AI-Powered Workflow in Practice
So, what does this look like day-to-day? A clinician or researcher simply uploads a patient's DICOM image series into the software. With a click, the AI model gets to work, analyzing every single slice, identifying the lesion, and generating a precise 3D contour around it. The entire task can be over in seconds.
Of course, this doesn't push the human expert out of the picture. Instead, it changes their role from tedious manual tracing to high-level oversight. After the AI generates its initial segmentation, a radiologist reviews the proposed outline. They can then make quick adjustments if needed, approve the final result, and move on.
This "human-in-the-loop" approach gives you the best of both worlds: the AI’s incredible speed and consistency, guided by a clinician’s diagnostic judgment and deep anatomical knowledge. This efficiency boost isn’t just about saving a few minutes; it makes large-scale analysis practical, allowing researchers to process huge datasets for clinical trials with perfect consistency.
Key Benefits of Automated Segmentation
Moving to AI-powered segmentation brings a few game-changing advantages that directly tackle the weak spots of older methods.
- Goodbye, Inter-Observer Variability: A trained AI model will segment the same tumor the exact same way, every time. This eliminates the natural variability between different people, leading to far more reliable and reproducible data.
- A Drastic Cut in Manual Work: A task that might take a radiologist 30 minutes or more to do by hand can be done by an AI in under a minute. This frees up invaluable time for experts to focus on what really matters: diagnosis, treatment planning, and patient care.
- High-Throughput Analysis Becomes Possible: For large research studies or busy hospitals, the ability to process hundreds of scans quickly and consistently is transformative. AI makes volumetric analysis scalable in a way we couldn't have imagined before.
The real value of AI here is its power to produce objective, quantifiable data at scale. By automating the most labor-intensive part of the process, it empowers clinicians and researchers to use volumetric data more routinely and with much greater confidence.
Comparison of Tumor Volume Calculation Methods
To put these approaches into perspective, it's helpful to see them side-by-side. Each method has its place, but the trade-offs in accuracy, time, and resources become clear when you compare them directly.
| Method | Typical Accuracy | Time Required per Case | Best For | Key Limitation |
|---|---|---|---|---|
| Manual | High (but observer-dependent) | 20-60+ minutes | Small, simple tumors; gold-standard validation | Highly subjective; prone to inter/intra-observer variability; very slow |
| Semi-Automated | High to Very High | 5-15 minutes | Complex shapes where some user guidance is needed | Still requires significant user input and can be time-consuming |
| AI-Driven | Very High (model-dependent) | < 1 minute | Large-scale studies; routine clinical workflows; standardized measurements | Performance depends entirely on training data quality; requires validation |
This table highlights the evolution of these techniques. While manual tracing set the standard, the efficiency and consistency offered by AI are redefining what's possible in both clinical practice and research settings.
The Importance of Validation and Oversight
As exciting as AI is, it's not a magic box. It's crucial to approach these tools with a practical mindset. Not all AI models are built the same, and for clinical use, it's absolutely essential to use software that has been rigorously validated and, where necessary, has received regulatory clearance from bodies like the FDA. This validation ensures the model actually performs accurately across different patient groups and imaging equipment.
Ultimately, AI is a powerful assistant, not a replacement for medical professionals. The final interpretation and clinical decisions must always rest with a qualified radiologist. Their expertise is irreplaceable for putting the AI's output into context, understanding the nuances of a specific case, and making sure the final tumor volume calculation is both accurate and truly relevant to the patient's care.
Common Questions on Tumor Volume Calculation
Even after you get a handle on the different methods, you'll find that real-world scenarios always bring up new questions. Let's tackle some of the most common ones that pop up for both clinicians and researchers trying to get accurate tumor volume measurements.
How Is Tumor Volume Different From RECIST?
This is probably the most frequent question I hear, and it gets to the heart of why we even talk about volume. The RECIST criteria (Response Evaluation Criteria in Solid Tumors) are the long-standing benchmark in clinical trials. But RECIST is a one-dimensional measurement—it just uses the longest diameter of a tumor. Think of it like measuring a building's shadow to guess its size.
Tumor volume, on the other hand, gives you the full three-dimensional picture. It measures the entire space the tumor takes up. While RECIST is simple and standardized, making it great for large trials, volume is a much more sensitive metric. It can pick up on subtle changes in tumor mass that a simple diameter measurement would completely miss, which is especially true for tumors with irregular, complex shapes.
What’s the Most Accurate Way to Calculate Tumor Volume?
For pure accuracy, nothing beats direct volumetric measurement from high-resolution CT or MRI scans. The gold standard involves outlining the tumor on every single image slice where it appears. This process, called segmentation, gives you a true, direct measurement without relying on geometric formulas that are often just rough estimates.
However, AI-powered segmentation is quickly becoming the new champion. A well-trained algorithm can often match or even surpass human accuracy. The real game-changer with AI is its consistency. It completely removes the small, inevitable variations you see between different radiologists, or even from the same radiologist having a good day versus a bad day. The "best" method really depends on your specific goals, the quality of your scans, and the tools you have on hand.
Can I Calculate Tumor Volume From a 2D Ultrasound Image?
You can, but you have to be aware of the trade-offs. With a 2D ultrasound, a sonographer can measure the length, width, and height of a lesion. You can then plug those numbers into a formula for an ellipsoid, like Volume = 0.523 x D1 x D2 x D3, to get an estimate. It’s a common approach for accessible tumors, like in the thyroid, or for tracking tumors in preclinical animal studies.
The big catch is that the result is heavily dependent on the operator's skill. Getting those three measurements perfectly perpendicular to each other on a squirming patient or a deep-seated lesion is incredibly challenging. For tumors that require high precision for treatment decisions, you really want to turn to 3D ultrasound, CT, or MRI for a more reliable volumetric analysis.
Takeaway: While possible, 2D ultrasound gives you an estimation of volume, not a direct measurement. Its accuracy hinges on the sonographer's technique and the tumor's specific characteristics.
Are There Any Free Software Tools for This?
Absolutely. This is one area where the research community has really stepped up. There are some incredibly powerful, open-source software platforms available that don't cost a dime. These are fantastic for academic research or for any clinic where a commercial software license just isn't in the budget.
Here are a couple of the most popular options:
- 3D Slicer: A highly versatile platform for all kinds of medical image analysis. It has sophisticated segmentation and visualization tools that make it a favorite among researchers.
- ImageJ (with plugins): This is a flexible, Java-based image processing workhorse. By adding the right plugins for handling medical image files (like DICOMs) and analyzing regions of interest, you can build a very powerful tool for volume calculation.
Both of these let you manually trace the tumor on each slice to compute the total volume. They definitely have a learning curve, but the capabilities they offer are right up there with many expensive commercial systems. This makes advanced tumor volume calculation accessible to just about anyone.
At PYCAD, we focus on pushing the boundaries of medical imaging. We build sophisticated AI into diagnostic workflows to help medical device companies and researchers achieve better accuracy and efficiency. See how our AI solutions can elevate your own projects by visiting https://pycad.co.