Let's get straight to the point: measuring a tumor by a single diameter is old news. To truly understand a tumor's behavior, calculating its volume is the only way to get a complete, three-dimensional picture. This perspective isn't just an academic exercise; it's absolutely crucial for everything from planning initial treatment to tracking how well a patient is responding to it.
Why Accurate Tumor Volume Is a Game Changer in Oncology
The move away from one-dimensional methods, like those in the classic RECIST (Response Evaluation Criteria in Solid Tumors) framework, toward full volumetric analysis is a massive leap forward for patient care. A single line measurement just can't capture the whole story, especially since tumors rarely grow as perfect, neat spheres. They're often irregular and complex.
Think about it. You could have two tumors with the exact same longest diameter. One might be a thin, flat mass, while the other is a dense, spherical growth. A simple diameter measurement would call them similar, but their actual impact—the tumor burden—is wildly different. Calculating the full tumor volume clears up that dangerous ambiguity.
Beyond a Single Number
When you have volumetric data, you're working with a much richer dataset. This has a direct impact on several key areas in the clinic:
- Sharper Treatment Planning: For a radiologist, knowing the precise volume and shape is everything. It allows them to target the tumor with pinpoint accuracy while sparing as much healthy surrounding tissue as possible.
- More Sensitive Response Assessment: A tiny change in a tumor's diameter might look insignificant on paper, but it can represent a huge shift in its actual volume. This sensitivity helps us spot earlier whether a treatment is working or failing.
- Clearer Prognostic Judgments: We can track the rate of volumetric change, a metric known as Tumor Volume Doubling Time (TVDT). This is a powerful predictor of how aggressive a tumor is and what the patient’s outcome might be.
A great real-world example comes from studies on papillary thyroid carcinoma. In a long-term study following 284 patients on active surveillance, full 3D measurements showed that while 80.2% of tumors were stable, another 6.7% actually shrank in volume by over 50%. A simple diameter check could easily miss this nuance, which is vital for deciding who truly needs intervention. You can dive into the specifics by reading the full tumor growth kinetics study.
A tumor's volume is a more direct reflection of its total cell population than any single linear measurement. This is why a 20% decrease in diameter can equate to a nearly 50% reduction in volume—a much more meaningful indicator of therapeutic success.
This level of detail isn't just about better data; it has direct consequences for patients. It could mean stopping a toxic therapy that isn’t working and switching to a better one weeks or even months sooner. By embracing the three-dimensional reality of a tumor, we can make smarter, data-backed decisions that genuinely improve patient outcomes.
Comparing Unidimensional vs Volumetric Tumor Assessment
When we pit the old way against the new, the differences become stark. Here's a quick look at the key differences and clinical implications when measuring tumors with a simple diameter versus a comprehensive volume.
| Metric | Unidimensional Measurement (e.g., RECIST) | Volumetric Measurement |
|---|---|---|
| Data Captured | Longest diameter only | Complete 3D shape and size |
| Tumor Shape | Assumes spherical or simple shapes; poor for irregular tumors | Accurately represents complex and irregular tumor morphology |
| Sensitivity | Low; can miss significant changes in tumor burden | High; detects small but meaningful changes in tumor mass |
| Clinical Use | Standardized for clinical trials, but has known limitations | Provides a more accurate picture for treatment planning and response assessment |
| Prognostic Value | Limited; based on a single, potentially misleading metric | Stronger; metrics like TVDT offer deeper insights into tumor aggressiveness |
Ultimately, while unidimensional measurements have served a purpose, they simply can't provide the granular detail needed for modern precision oncology. Volumetric assessment gives clinicians the confidence that their decisions are based on the most accurate and complete information available.
Choosing the Right Imaging for Volumetric Analysis
The entire process of calculating tumor volume accurately starts with one thing: the quality of your medical images. In this field, the "garbage in, garbage out" rule is an unforgiving reality. You can have the most sophisticated software and the most elegant formulas, but they're useless if the scan itself is blurry, inconsistent, or just the wrong tool for the job.
So, your first major decision is which imaging modality to use. We're primarily talking about Computed Tomography (CT), Magnetic Resonance Imaging (MRI), or Positron Emission Tomography (PET). This isn't an arbitrary choice. It's a strategic decision that hinges on the tumor's location, its type, and what you’re trying to learn from the measurement. Each modality has unique strengths that directly impact how well you can map out and measure a tumor.
CT Scans for High Spatial Resolution
For many applications, particularly tumors in the lungs, liver, and bones, the Computed Tomography (CT) scanner is the workhorse. Its greatest strength is its incredible spatial resolution. CT gives you razor-sharp anatomical images, which makes it much easier to see the fine edges where a tumor stops and healthy tissue begins.
This level of detail is crucial for solid, well-defined tumors. If you're tracking a lung nodule, for instance, a CT provides the crisp boundaries you need for precise segmentation. Another huge practical advantage is how fast CT scans are. The speed helps minimize motion artifacts—like a patient breathing—that can otherwise blur the tumor's shape and throw off your measurements.
MRI for Superior Soft Tissue Contrast
Now, when you’re dealing with tumors in soft tissues—think brain, prostate, or certain musculoskeletal cancers—Magnetic Resonance Imaging (MRI) is almost always the better choice. While its spatial resolution might not always match a CT, its contrast resolution is in a league of its own. MRI is fantastic at telling the difference between various types of soft tissue, like separating a tumor from nearby muscle, fat, or inflammation (edema).
By using different MRI sequences (like T1-weighted, T2-weighted, and FLAIR), you can highlight different tissue properties, giving you a much richer, multi-faceted picture of the tumor. A contrast-enhanced T1-weighted sequence, for example, is priceless for lighting up the active, blood-rich parts of a brain tumor. That information is absolutely essential for accurate volume calculation and planning radiation therapy.
Remember, the goal isn't just to see the tumor, but to precisely define its three-dimensional boundaries. For a glioma in the brain, MRI’s ability to differentiate the tumor core from surrounding inflammation is something a CT scan simply cannot replicate with the same fidelity.
PET Scans for Functional Imaging
Positron Emission Tomography (PET) scans bring a totally different kind of information to the table. Instead of showing you anatomy, they show you metabolic activity. By tracking how a radioactive tracer (usually FDG) is absorbed by cells, PET scans light up areas of high cellular activity—a classic hallmark of many cancers.
PET scans themselves have a lower spatial resolution, but their functional data is an incredibly powerful tool when combined with CT or MRI. A PET/CT scan, for example, overlays the metabolic "hot spots" from the PET onto the detailed anatomical map from the CT. Fusing these images helps clinicians:
- Define Active Tumor Volume: It can show the difference between active cancer cells and necrotic (dead) tissue inside a mass.
- Identify Metastases: It helps find other metabolically active spots in the body that might be completely invisible on a standard CT or MRI.
When you're assessing how well a treatment is working, a drop in a tumor's metabolic activity on a PET scan can be a much earlier sign of success than waiting for it to physically shrink on a CT.
The Critical Impact of Imaging Protocols
It's not enough to just pick the right machine. The specific protocol used for the scan is just as important. Small technical details can have a massive downstream effect on your ability to perform an accurate volumetric analysis.
Take slice thickness, for example. This is the thickness of each cross-sectional image the scanner creates. If you use thick slices, say 5 mm, you risk a "partial volume effect." This is where a single pixel (or voxel) on the image contains a mix of both tumor and healthy tissue, effectively blurring the tumor’s true edge.
On the other hand, thin slices (1-2 mm) give you a much more detailed and accurate 3D model, making your segmentation far more precise. If you're serious about calculating tumor volume, you have to push for thin-slice acquisitions. It’s non-negotiable.
Likewise, the use and timing of contrast agents are critical. A poorly timed injection can lead to weak tumor enhancement, making it tough to separate the mass from everything around it. If you want to reliably compare a tumor's volume from one scan to the next, you have to insist that both scans were done using the exact same, standardized protocol. Without that consistency, you're just comparing apples to oranges.
Mastering the Formulas for Manual Volume Estimation
Before modern software gave us the power of automated segmentation, we had to rely on good old-fashioned math to estimate tumor volume from 2D scans. And while software is undoubtedly more precise, understanding these foundational formulas is far from just an academic exercise. They're still incredibly useful for a quick check and provide the conceptual bedrock for the more advanced techniques we use today.
The most common method treats the tumor as a perfect ellipsoid—basically, a 3D oval. By making this geometric assumption, we can use some pretty straightforward formulas to get a solid volume estimate from just a few measurements off a CT or MRI.
The Classic Ellipsoid Formula
You might remember this one from geometry class. It's the standard formula for the volume of an ellipsoid and gives us a great starting point for a three-dimensional estimate.
The formula is: V = 4/3 * π * a * b * c
Let's break that down:
- V is what we're solving for—the total volume.
- π (pi) is our old friend, the constant ~3.14159.
- a, b, and c are the radii of the tumor along its three main axes. Think of them as half the length, half the width, and half the height.
To use it, you'd measure the tumor's longest diameter, its widest perpendicular diameter, and its greatest height on the scans. Then, just divide each of those numbers by two to get your radii and plug them into the formula.
The Modified Formula: A Practical Shortcut
While the classic formula is mathematically pure, it can be a bit clunky for quick work in a clinical setting. That's why a simplified, modified version became so popular in both clinical practice and research. It's much faster.
This adapted formula is simply: V = 0.52 * L * W²
In this version, L stands for the longest diameter, and W is the greatest perpendicular diameter you can find on the same image slice. The formula works by assuming the third dimension (height) is roughly the same as the width, which holds up surprisingly well for many ovoid tumors. The 0.52 constant is just a neat shortcut for π/6, making the calculation much easier to do on the fly.
Let's say we're looking at a lung nodule that measures 2.4 cm at its longest and 1.8 cm at its widest.
- V = 0.52 * 2.4 * (1.8)²
- V = 0.52 * 2.4 * 3.24
- V ≈ 4.04 cm³
This shortcut gives you a rapid, back-of-the-envelope volume that's perfect for getting a quick sense of tumor size without firing up specialized software.
Key Insight: Remember, these formulas are geometric approximations. They treat every tumor like a smooth, perfectly shaped object. Their accuracy is directly tied to how closely the real-world tumor actually resembles a perfect sphere or ellipsoid.
The Unspoken Limitations of Formulas
This convenience, however, comes with some big caveats. The single greatest weakness of these formulas is their struggle with irregularly shaped tumors. If you're dealing with a spiculated, amorphous, or "star-shaped" mass, it just doesn't fit the smooth ellipsoid model. In these cases, a formula-based estimate will almost always be off—and it usually underestimates the true volume.
Then there's the challenge of measurement consistency. Where, exactly, do you place the digital calipers on a fuzzy or poorly defined tumor edge? It's easy for two different people to get slightly different diameter readings, which can lead to significant variability in the final volume.
This problem is amplified by known biases in measurement practices. For example, one analysis of lung adenocarcinomas found that when measuring removed specimens, pathologists tended to round their numbers—a full 43% of measurements were reported at half-centimeter increments. Radiologists reading scans, on the other hand, only showed this rounding pattern 20.3% of the time. You can learn more about these challenges of volumetric tumor assessment. These small differences in diameter get magnified when you calculate volume because the formulas are cubic.
Ultimately, these formulas are powerful tools for quick estimation, but they aren't the gold standard. They're a vital stepping stone to understanding why the voxel-based segmentation methods we'll cover next are usually the superior choice when you need true precision.
When simple formulas aren't enough, we need to get serious about accuracy. While basic calculations give us a decent estimate, they're just that—an estimate. To truly understand a tumor's size and complexity, we have to move past geometric assumptions and trace its actual, often irregular, shape.
This is where image segmentation becomes indispensable. It's the difference between a rough guess and a precise measurement.
Think of it like this: instead of treating the tumor as a neat sphere or ellipsoid, segmentation is the process of digitally outlining its exact border on every single slice of a CT or MRI scan. This method captures the real-world shape, warts and all, including any weird extensions or complex surfaces. We're no longer relying on a formula; we're directly measuring the space the tumor occupies.
The magic behind this is a concept called voxel counting. A voxel is just a 3D pixel—a tiny cube of data from the scan with its own specific dimensions, like 1 mm x 1 mm x 2 mm. Once the tumor has been outlined across all the relevant image slices, the software simply adds up every single voxel inside that boundary.
The final calculation is clean and direct:
Total Tumor Volume = Total Voxel Count × Volume of a Single Voxel
This approach is fundamentally more accurate because it doesn't matter if the tumor is shaped like a ball, a starfish, or something far more chaotic. It measures the volume it truly occupies.
This visual breaks down the workflow, from taking basic measurements to applying formulas and, finally, achieving true precision with segmentation.
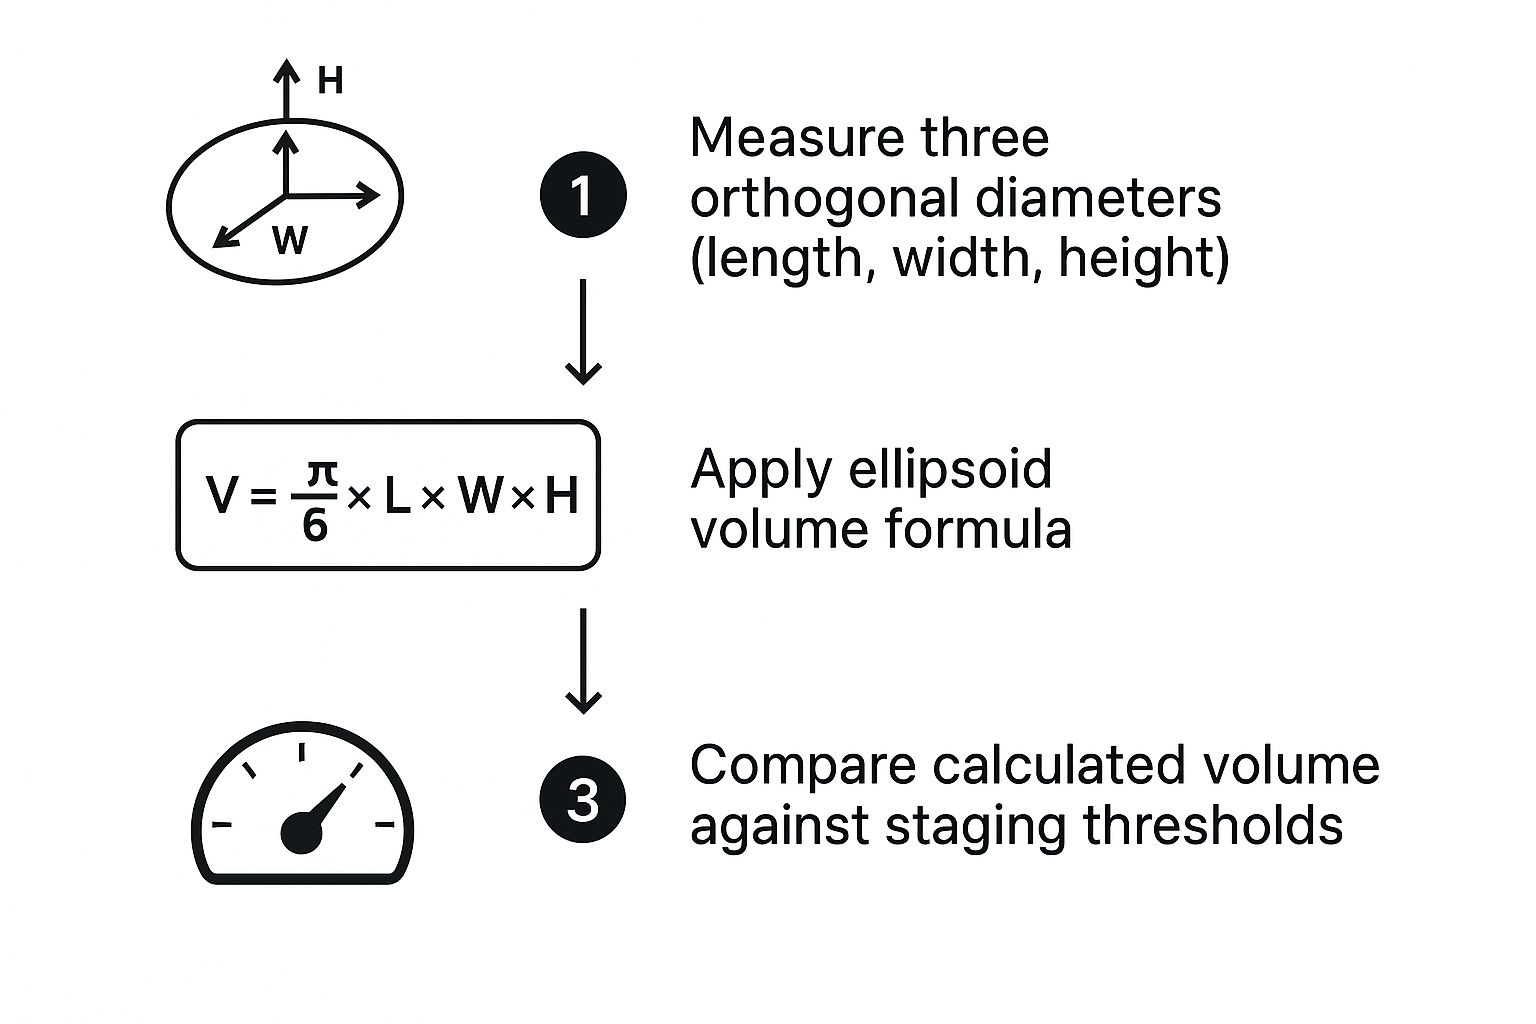
As you can see, each step gets us closer to the truth. Moving from simple diameters to a formula-based volume is an improvement, but accounting for the entire 3D structure through segmentation is the gold standard.
Choosing Your Segmentation Approach
Getting that precise outline isn't a one-size-fits-all job. There are a few ways to tackle it, each offering a different balance of speed, effort, and precision. You have to pick the right tool for the task at hand.
A Practical Comparison of Tumor Segmentation Methods
Choosing a segmentation technique often comes down to balancing the need for accuracy with the constraints of time and resources. Here’s a look at the most common methods and where they shine.
| Segmentation Method | Pros | Cons | Best For |
|---|---|---|---|
| Manual | Considered the "gold standard" for accuracy; handles ambiguous boundaries well. | Extremely time-consuming, labor-intensive, and prone to user fatigue. | Complex cases with poor image quality or ill-defined tumors where expert judgment is critical. |
| Semi-Automated | Much faster than manual; balances automation with human oversight and correction. | Requires user interaction; results can vary based on initial "seed" placement. | Routine clinical workflows where speed is important, but a human expert must verify the final outline. |
| Fully-Automated | Incredibly fast and consistent; removes inter-user variability. | Accuracy depends heavily on the quality of the AI model and its training data. | High-throughput research, clinical trials, or medical device applications needing rapid, standardized results. |
Ultimately, the goal is to find a method that delivers the precision you need within a workflow you can realistically implement. For many, a semi-automated or fully-automated solution hits that sweet spot.
The Real-World Advantages of Segmentation
So, why go through the extra steps of segmentation? The payoff becomes crystal clear in complex clinical situations. For tumors with irregular shapes, like those often found in brain or pancreatic cancer, segmentation isn't just a better option—it's the only option that reflects reality. Formulas simply can't handle their complexity.
Key Takeaway: The primary benefit of voxel-based segmentation is its power to quantify the true tumor burden, no matter the shape. For an irregularly shaped tumor, a formula might underestimate the volume by as much as 30-40%—a clinically massive error that segmentation completely avoids.
This level of precision has huge implications, especially in radiation oncology. As pioneering research from physicists like Dr. Ivan Cordrey has demonstrated, the tumor's surface area—a metric you can only get from segmentation—is vital for calculating and minimizing radiation damage to healthy tissue. With precise volume and surface data, oncologists can create highly targeted treatment plans that hit the tumor harder while sparing surrounding organs. You can learn more about these groundbreaking concepts in radiation oncology directly from the source.
In research and clinical trials, the consistency of segmentation is a game-changer. It reduces variability between different clinicians, ensuring that when a change in volume is measured, it’s because of a real biological event—not just because two people measured a diameter differently. This reliability is transforming how we evaluate treatment effectiveness, giving us a more objective way to assess how patients are responding.
For any serious effort in oncology, from treatment planning to drug development, segmentation is the definitive path to calculating tumor volume.
Bringing Tumor Volume Measurement to Life with Imaging Software
All the theory on formulas and segmentation is just that—theory. The real work begins when you fire up a medical imaging application. This is where you roll up your sleeves and turn raw scan data into a concrete, measurable volume. Let's walk through how this actually plays out in practice using powerful, open-source tools like 3D Slicer or ITK-SNAP, which are staples in both clinical research and day-to-day practice.
Your first move is always loading the imaging data. This typically arrives as a DICOM series, the standard format for medical scans. It’s more than just pictures; it’s a rich dataset containing crucial details like slice thickness and patient info. The software then does something brilliant: it stacks these 2D slices into a navigable 3D view of the anatomy, letting you scroll through the axial, sagittal, and coronal planes.
Finding and Outlining the Tumor
With the 3D dataset on your screen, your next task is to pinpoint and define the tumor's boundaries. This process, called segmentation, is without a doubt the most critical—and often the most difficult—part of the job. You're essentially creating a digital mask that perfectly overlays the tumor on every single slice where it appears.
Good software gives you a whole toolbox for this. You could go fully manual, meticulously tracing an outline around the tumor slice by slice. While this offers total control, it's incredibly tedious and time-consuming, especially for a large tumor spanning dozens of slices. I’ve been there, and it’s a recipe for eye strain.
A much smarter approach is to use semi-automated tools. For instance, you can place a few "seed points" inside the tumor and let an algorithm like "Region Growing" expand to find the natural borders based on pixel intensity differences. This simple step can often get you 80% of the way there in a fraction of the time.
The Art of Refining the Segmentation
Let’s be realistic: no automated tool is perfect. After that initial pass, you'll almost certainly need to do some manual cleanup. This is where your anatomical knowledge truly shines. You'll scroll through, slice by slice, hunting for areas where the algorithm got it wrong.
- Over-segmentation: This is when the mask "bleeds" into healthy, surrounding tissue. You'll need to grab a digital eraser tool and carefully trim the mask back to the true edge.
- Under-segmentation: The opposite problem, where the algorithm misses parts of the tumor. Here, you’ll use a digital "paintbrush" to fill in those gaps.
My Go-To Tip: Get comfortable with the interpolation feature. You don’t have to manually outline every single slice. Instead, you can trace the tumor on a few key slices—maybe slice 10, then 15, then 20—and the software will intelligently estimate the shape on the slices in between. This trick alone can slash your segmentation time in half with minimal impact on accuracy.
This refinement stage is a blend of art and science. It demands a sharp eye for subtle shifts in tissue texture and density, all to ensure your final segmentation is as faithful to the real anatomy as possible.
Getting the Final Volume Report
Once you’re confident in your 3D segmentation, the last step is almost anticlimactic. The software handles all the heavy lifting. With a single click on a button like "Calculate Statistics" or "Label Statistics," the program executes the voxel counting we talked about earlier.
It systematically counts every single voxel inside your digital outline and multiplies that number by the known volume of each voxel (pulled directly from the DICOM metadata). What you get is a highly precise measurement of the total tumor volume, usually presented in cubic centimeters (cm³) or milliliters (mL).
The software then spits out a handy report, which typically includes:
- Total Volume: The final, precise volume calculation.
- Voxel Count: The total number of voxels making up the segmentation.
- Intensity Statistics: Useful data like the mean, median, and standard deviation of signal intensity within the tumor, which can offer deeper clinical insights.
This entire workflow—from loading the scans to getting that final number—is how we move beyond simple ballpark estimates. It provides a robust, repeatable, and accurate method for calculating tumor volume, forming the very foundation of modern oncologic assessment and research.
Turning Raw Numbers into Clinical Wisdom
Getting an accurate tumor volume is a huge technical achievement, but it's really just the starting point. The real magic happens when we interpret that number to guide patient care. A single volume measurement is a snapshot; its true power is revealed when we track it over time to understand how a tumor is behaving and what it might do next.
This is where the science of measurement meets the art of medicine. A one-time volume measurement is great for initial staging or planning radiation therapy, but watching that number change across several scans tells us a much richer story about the tumor's growth pattern. This leads us to one of the most powerful predictive tools in oncology.
The Power of Tumor Volume Doubling Time
Tumor Volume Doubling Time (TVDT) is exactly what it sounds like: a calculation of how long it takes for a tumor to double in size. It's a direct window into the tumor's aggressiveness. A short TVDT often points to a fast-growing, aggressive cancer, whereas a long TVDT might suggest a more slow-moving, indolent mass.
To figure out the TVDT, you need at least two volume measurements from two different points in time. The formula itself can look a bit intimidating, but the idea behind it is straightforward—it's just measuring the rate of growth between two scans. This simple metric is incredibly useful for:
- Predicting Outcomes: A faster doubling time is often linked to a poorer prognosis, signaling that treatment needs to be more urgent or aggressive.
- Shaping Treatment Plans: It helps us distinguish between tumors that need immediate action and those that can be safely monitored, a practice known as active surveillance.
A Better Way to Measure Treatment Response
Beyond predicting a tumor's behavior, volumetric analysis is also a far more reliable way to see if a treatment is actually working. Old-school methods that rely on a single diameter measurement can be surprisingly deceptive. A tumor might shrink in one direction but bulge out in another—a critical detail that a simple 1D measurement would completely miss.
Volume gives us a clear, three-dimensional picture. Time and again, research has shown that changes in volume are a much more sensitive indicator of how a tumor is responding to therapy. For instance, one major study highlighted how volumetric data could sharply distinguish between tumor types based on treatment response. It found a median volume reduction of 45.9% in tumors with certain genetic mutations, compared to just 4.4% in tumors without them. You can dive deeper into how volumetric data sharpens response assessment in the published research.
After just three weeks of treatment, volumetric analysis spotted significant changes in 75% of tumors. In contrast, traditional single-dimension measurements only picked up on changes in 46% of cases. That means clinicians get a much earlier and clearer signal about whether a treatment is effective.
Why Consistency is Everything
The entire value of tracking tumor volume hinges on one simple principle: consistency. To be certain that a change in volume is real—and not just a wobble in your measurement technique—every step of the process has to be standardized from one scan to the next.
- Imaging Protocols: Always use the same scanner settings, slice thickness, and contrast agents for every follow-up exam.
- Segmentation Techniques: For any given patient, stick with the same software and the same segmentation approach, whether it's manual, semi-automated, or AI-powered.
When you lock down your process, you can be confident that a 30% drop in volume represents a genuine response to therapy, not just a fluke from inconsistent methods. This discipline is what elevates tumor volume measurement from a simple technical task to a foundational element of modern, personalized cancer care.
Answering Your Questions About Tumor Volume Measurement
When it comes to measuring tumor volume, a few common questions always pop up, especially concerning accuracy and how these measurements translate to clinical practice. Let's walk through some of the nuances you'll encounter.
How Much Does Tumor Shape Really Matter?
The shape of a tumor is a massive factor in how accurately you can measure it. For a growth that’s mostly round or oval-shaped, you can get a decent ballpark figure using a simple formula like V = 0.52 * L * W². It’s quick and easy.
But the moment you’re dealing with something more complex—like a tumor with irregular borders or spiculated tendrils reaching into surrounding tissue—those simple formulas start to fall apart. They just can't account for the nooks and crannies. This is where segmentation-based methods, which meticulously count every single voxel the tumor occupies, really shine. They measure the true, occupied space, giving you a precise volume no matter how complex the shape.
A Quick Tip from Experience: A simple formula can easily underestimate the volume of a highly irregular tumor by 30% or more. This isn't just a minor error; it's a clinically significant discrepancy that voxel-based segmentation completely sidesteps by capturing the tumor's true form.
Are There Standard Rules for Judging Treatment Response?
Yes, there are established guidelines, though the specifics can shift depending on the type of cancer or the rules of a particular clinical trial. For example, a framework like vRECIST might define a partial response as a >65% reduction in tumor volume.
On the flip side, an increase of more than 73% could be a clear sign that the disease is progressing. The most important thing is to stick to the protocol you’ve been given, whether it's for a specific study or your institution's standard practice. This consistency is what makes the data reliable and clinically meaningful.
At PYCAD, we live and breathe this stuff. We focus on creating AI-driven segmentation tools that deliver this exact level of precision and consistency to medical imaging. Our goal is to help medical device companies and researchers get the accurate volumetric data they need for powerful clinical insights. Find out how we can help you move your project forward.