Imagine a digital laboratory where raw scientific images are transformed into measurable, objective data. That’s the core function of image lab software—it's a powerful analytical engine, not just a photo editor. Think of it as a digital microscope on steroids, allowing scientists to see far beyond the pixels and extract real, meaningful insights.
From Pixels to Scientific Proof
At its heart, image lab software builds the crucial bridge between what we can see and what we can prove.
Picture a biologist studying cell division. To the naked eye, it’s a fascinating visual process. But to publish credible research, they need hard numbers: How many cells are there? What's their average size? How quickly are they multiplying? This is exactly where the software steps in, automating the otherwise painstaking process of identifying, counting, and measuring every object in an image.
This jump from a qualitative observation ("that looks like a lot of cells") to quantitative analysis ("there are exactly 4,723 cells with an average diameter of 12.5 micrometers") is the bedrock of modern science. It strips away subjectivity, making sure experimental findings are repeatable, reliable, and statistically sound.
The Core Purpose of Analysis Tools
The main goal here is simple: turn visual data into a structured format ready for statistical number-crunching. This process involves a few key steps that are fundamental to pretty much any scientific imaging workflow.
These tools are specifically built to handle the unique challenges of scientific data, offering power that standard image viewers just can't match.
Let's quickly break down what these core functions look like in practice. The table below outlines the foundational capabilities that really define what image lab software does.
Core Functions of Image Lab Software at a Glance
| Function | Description | Example Application |
|---|---|---|
| Object Segmentation | Automatically identifying and isolating specific objects (like cells or particles) from the image background. | A biologist isolating individual cancer cells in a tissue sample to count them. |
| Quantitative Measurement | Calculating specific properties of segmented objects, such as area, diameter, intensity, and shape. | A materials scientist measuring the size distribution of pores in a new filter membrane. |
| Automated Counting | Systematically counting all instances of a defined object within a single image or a batch of images. | A pharmacologist counting bacterial colonies in a petri dish to test an antibiotic's effectiveness. |
| Data Extraction & Export | Compiling all measurements into a structured format (like a CSV or Excel file) for further statistical analysis. | An agronomist exporting data on leaf size and disease spots for analysis in R or Python. |
As you can see, each function serves a distinct purpose in moving from a raw picture to actionable data. These aren't just fancy features; they are the essential mechanics that drive discovery.
The demand for this kind of automation is surging. The global laboratory informatics market, which includes image lab software, is already a major field. Valued at roughly USD 3.86 billion in 2024, it's expected to climb to USD 5.21 billion by 2030. This growth isn't surprising—it directly reflects how much modern labs depend on software to manage and interpret staggering volumes of data. You can dig deeper into these trends in the laboratory informatics market report from Grand View Research.
In essence, this software provides the tools to make images "smarter." It's not about improving how an image looks; it's about improving what an image can tell us.
This capability is a game-changer for researchers across countless fields.
From medical teams tracking tumor growth in MRI scans to materials scientists analyzing microscopic flaws in new alloys, the applications are incredibly broad. The software ensures that scientific conclusions aren't just based on a researcher's interpretation but are backed by solid, reproducible data. By turning images into evidence, these tools have become absolutely essential for discovery and innovation.
Diving Into the Essential Toolkit
To really get a feel for what image lab software can do, we have to pop the hood and look at the engine. These features aren’t just a random assortment of buttons; they work together in a logical sequence, turning a raw, messy image into a clean, structured set of data you can actually use.
Think of it as a digital assembly line for discovery. Each tool has a job, guiding the image from its initial state to a final dataset that’s ready for serious analysis. Let's walk through the key stops along this line.
Image Import and Compatibility
The whole process kicks off the moment you bring an image into the software. But this isn't as simple as opening a family photo. Scientific instruments—from electron microscopes to medical scanners—often spit out images in weird, proprietary file formats most programs can't read.
A top-tier image lab software has to be a universal translator. It needs to open these specialized files without a hitch, preserving all the crucial metadata packed inside. We're talking about things like microscope settings, timestamps, and spatial calibrations. Without that context, your analysis is built on a shaky foundation.
Getting this first step right ensures the data’s integrity is locked in from the start, giving you a perfect digital copy of what the instrument originally captured.
Processing and Enhancement Tools
Let's be honest, raw scientific images are rarely picture-perfect. They often come with baggage like background noise, uneven lighting, or poor contrast, all of which can hide important details and throw off your measurements. This is where the processing and enhancement tools step in as a digital cleanup crew.
These aren't your typical Instagram filters. They're precise mathematical operations designed to clean up the image for analysis, not just make it look pretty. Common tools in the kit include:
- Noise Reduction Filters: These are smart algorithms that smooth out that "snowy" or "grainy" texture in an image without blurring the important stuff.
- Background Subtraction: This technique computationally flattens out uneven lighting, creating a consistent background so you can measure the brightness of your objects accurately.
- Contrast Enhancement: Using methods like histogram equalization, the software can stretch the range of pixel brightness, making faint objects pop and stand out from their surroundings.
These tweaks are essential for prepping the image for the heavy lifting that comes next.
The Art of Image Segmentation
If there's one make-or-break step in the entire workflow, it's segmentation. This is where you teach the software how to identify and outline the specific objects you care about. It’s how the program learns to “see” what you see—whether that’s a single cell in a crowded tissue sample or a tiny crack in a piece of metal.
You're essentially giving the software a rulebook for telling your target apart from everything else. This can be done in a few ways:
- Thresholding: A straightforward method where the software grabs all the pixels that fall within a certain brightness range.
- Edge Detection: Algorithms that hunt for sharp changes in intensity, effectively drawing an outline around objects.
- AI-Powered Segmentation: More and more, machine learning models are trained on sample images to find complex or weirdly shaped objects with an accuracy that can even beat the human eye.
Correct segmentation is the bedrock of reliable data. If the software can't draw the line around an object correctly, every single measurement you take afterward will be off.
Quantification and Data Extraction
Once your objects are properly segmented, the software can finally get down to business: quantification. This is the magic moment where pictures are turned into numbers. It’s where image lab software truly proves its worth, systematically measuring dozens of properties for every single object it found.
The software can pull all sorts of metrics, such as:
- Morphological Features: Things like area, perimeter, diameter, and roundness.
- Intensity Measurements: Including the average brightness, brightest point, or total fluorescence.
- Positional Data: The precise X/Y coordinates of each object's center.
This step generates a huge, structured spreadsheet. Each row is a different object, and each column is a different measurement. This is the data you can finally export for statistical analysis, graphing, and drawing your final conclusions, completing the journey from raw pixels to scientific proof.
How AI Is Reshaping Image Analysis
Artificial intelligence isn't just an add-on; it's the engine driving the biggest changes we've seen in image lab software. It’s what’s turning these platforms from basic, rule-following tools into smart partners that can actually learn from and make predictions based on visual data. This leap forward blows past the old limits of manual, human-only analysis.
Think of it like training a brand-new, incredibly fast-learning apprentice. Instead of writing code to define every possible edge of a cell, you just feed the AI thousands of examples of what a cell looks like. It starts to pick up on the subtle patterns, textures, and variations all on its own. Before long, it can spot what you’re looking for with a speed and consistency that a human eye simply can't match over long hours.
This is a game-changer in fields like medical diagnostics, where an AI trained on countless medical scans can learn to flag the faintest signs of disease—markers that might be missed during a routine check. The goal isn't to replace the expert; it's to give them a powerful new tool.
Automation and Pinpoint Accuracy
One of the first things people notice when they bring AI into the lab is the immediate automation of incredibly tedious work. Take manual segmentation, for example, where a researcher has to painstakingly trace the outline of hundreds of particles or cells. An AI can knock that out in a fraction of the time. This frees up brilliant people to focus on the bigger picture—interpreting the results and pushing their research forward.
But it’s not just about doing things faster. AI brings a level of consistency to the table that's nearly impossible for people to maintain. A researcher might analyze an image slightly differently on a Monday morning compared to a Friday afternoon. An AI model, on the other hand, performs the exact same analysis every single time, which is absolutely critical for generating trustworthy, reproducible data.
AI-driven tools don't just copy human actions; they perform them with a mathematical precision that erases human error and inconsistency. This ensures every analysis is held to the same standard, making the final research findings that much stronger.
Moving From "What Is" to "What If"
This is where things get really interesting. Traditional software is great at telling you what’s in an image—how many cells are present, the size of a defect, and so on. But AI-powered image lab software is starting to predict what might happen next.
- Predictive Health: In oncology, an AI can look at the shape and texture of tumor cells from a biopsy and help predict how aggressive the cancer might be or which treatment a patient is most likely to respond to.
- Forecasting Material Failure: By analyzing the microscopic structures in a new alloy, a model can forecast its breaking point under stress, helping engineers build safer and more resilient products.
- Predicting Crop Yields: AI can assess drone footage of a field, looking at plant color and density to predict the final harvest with remarkable accuracy long before it happens.
This isn't magic. It's machine learning. These models are trained on massive datasets that pair images with their known outcomes. Over time, the AI learns to connect specific visual cues to future events, effectively turning a simple image into a powerful forecasting tool.
Deeper Segmentation and Feature Recognition
AI has also completely overhauled the fundamental task of segmentation. Old-school methods often failed when dealing with images that had poor contrast or objects with fuzzy, complex borders. This is exactly where modern deep learning models shine.
These AI models can be trained to see and trace even the most challenging shapes with incredible precision. Imagine an AI perfectly outlining the tangled web of neurons in a brain scan or picking out individual fibers in a high-tech composite material. This opens up analysis for structures that were once considered far too complex to quantify automatically. The level of detail we can now extract gives researchers richer, more granular data than ever before, setting the stage for brand-new discoveries.
Choosing the Right Image Lab Software
Picking the right image lab software can feel overwhelming, but it doesn't have to be. The secret isn't chasing the longest feature list; it's about zeroing in on what your research actually needs. A platform that's a perfect fit for cell biology might be completely wrong for materials science, so the first and most critical step is matching the software’s capabilities to your specific goals.
So, where do you start? Begin by thinking about your daily grind. Are you counting particles, measuring fluorescence, or tracking how things move over time? Seriously, grab a pen and paper (or open a doc) and list out your non-negotiable analysis tasks. This simple checklist will become your North Star, helping you cut through the marketing fluff and find a tool that genuinely solves your problems.
Aligning Technical Requirements with Your Lab
Beyond the shiny features, you have to get practical. The most amazing software in the world is useless if it doesn't play nice with your existing equipment. Before you even think about committing, you need to run through a few technical checkpoints to make sure it will integrate smoothly into your lab’s workflow.
Here’s what you absolutely need to confirm:
- Operating System: Does it run natively on your lab’s computers, whether you're a Windows, macOS, or Linux shop?
- Hardware Integration: Can the software talk directly to your microscopes, cameras, and scanners? Direct communication is key to a streamlined process.
- Data Formats: Will it open the proprietary file formats your instruments spit out? Losing critical metadata is not an option.
- Interoperability: Can you easily export data into a format that works with your other analysis tools, like R, Python, or specialized statistical programs?
Nailing these details upfront will save you from a world of technical headaches down the road.
Balancing Usability and Advanced Power
One of the biggest decisions you'll make is finding the sweet spot between a user-friendly interface and the power for advanced, custom analysis. Some tools offer a simple point-and-click experience, which is fantastic for routine tasks and getting new lab members up and running fast. The downside? That simplicity can sometimes mean less flexibility.
On the flip side, more complex platforms often come with a steeper learning curve but might offer scripting capabilities or a massive library of algorithms. This opens the door to creating highly customized, automated analysis pipelines that can save you an incredible amount of time in the long run. The right choice really hinges on your team's technical comfort level and the complexity of your research.
The best software isn't the one with the most features. It's the one that empowers your team to get reliable results, efficiently. Finding that perfect balance between accessibility and raw capability is what really matters.
Evaluating Cost Models and Support Structures
Finally, let's talk money and support. The world of image lab software covers a huge range, from powerhouse open-source tools that are completely free to all-inclusive commercial subscriptions. An open-source giant like ImageJ/Fiji is incredibly capable and backed by a massive scientific community, but when things go wrong, you’re relying on user forums for help.
Commercial software usually comes with a hefty price tag, but that often includes dedicated customer support, regular updates, and professional training. When you're looking at options, a solid understanding of software licensing management is crucial for keeping costs in check and staying compliant. Your decision here doesn't just affect your budget; it determines how quickly you can solve problems and get your team productive.
Comparison of Image Lab Software Types
To help you weigh the pros and cons, let’s break down the three main types of software. This table gives a quick overview to guide your decision-making process.
| Factor | Open-Source (e.g., ImageJ) | Commercial (e.g., Amira) | Cloud-Based (SaaS) |
|---|---|---|---|
| Cost | Free | High initial cost or subscription | Monthly/annual subscription |
| Support | Community forums, user-driven | Dedicated customer support, training | Professional support team |
| Flexibility | Extremely high (plugins, scripting) | High, but within platform limits | Varies, often API access |
| Ease of Use | Steeper learning curve | Generally user-friendly | Typically intuitive interface |
| Accessibility | Local installation required | Local installation, license-locked | Access from any device |
Ultimately, the choice between open-source, commercial, or cloud-based software depends entirely on your lab's budget, technical expertise, and specific research needs. There's no single "best" answer, only the best fit for you.
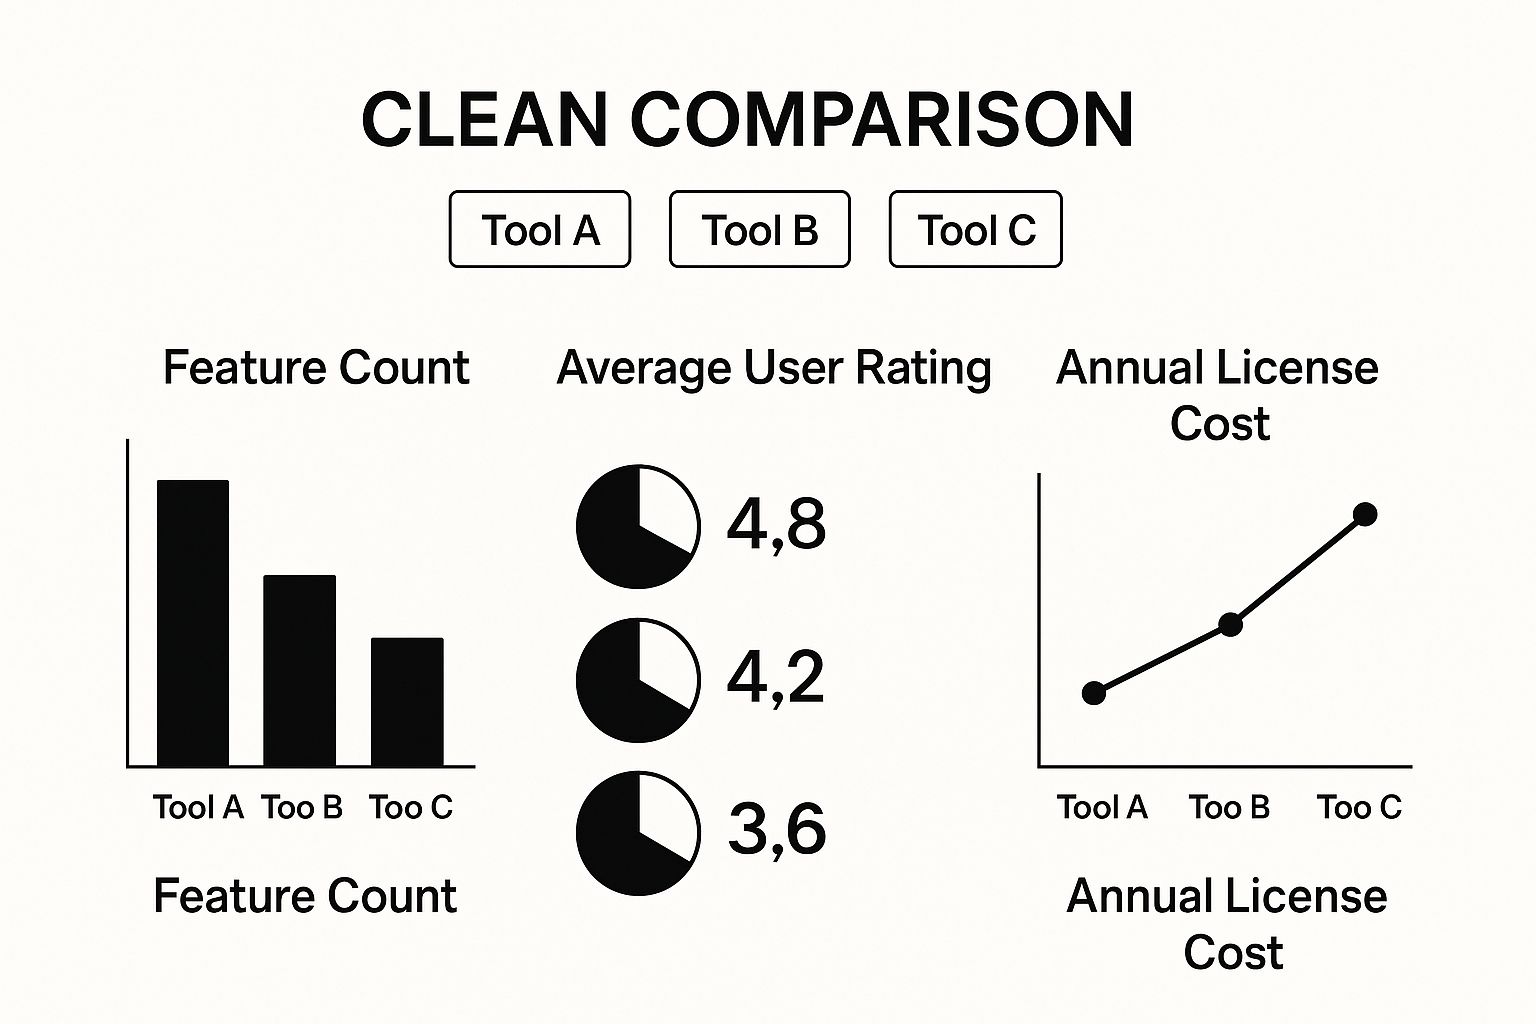
This image illustrates the typical trade-offs you'll encounter. Tool A might have all the bells and whistles but comes at a premium, while Tool C is easier on the budget but more limited. The growth in this space is undeniable—the medical image analysis software market is expected to reach USD 4.26 billion by 2025. It’s a dynamic field with options for every kind of priority and budget.
Where the Rubber Meets the Road: Real-World Applications
It's one thing to talk about features and algorithms, but the real magic of image lab software happens when you see what it can do in the real world. These aren't just niche tools for a few specific labs; they are the engines driving discovery and innovation across countless industries. From developing life-saving medicines to building next-generation materials, the ability to turn pictures into hard data is making a huge difference.
Let's step out of the lab for a moment and look at a few concrete examples. We'll explore how this software gives researchers and engineers clear, data-driven answers to some of their toughest problems, transforming visual information into powerful, actionable insights.
Biomedical Research and Drug Discovery
In the world of biomedical science, so much of the action happens at a scale we can't see. Researchers fighting diseases like cancer need to understand exactly what’s happening with individual cells—how they grow, how they react to drugs, and how they spread. When a single tissue sample can hold millions of cells, analyzing them manually is simply out of the question.
Picture a team on the hunt for a new cancer drug. Their mission is to find a compound that kills cancer cells but leaves healthy cells untouched. They run experiments, treating cell cultures with hundreds of different drug candidates and using automated microscopes to snap pictures of the results. This is where image lab software steps into the spotlight.
- Automated Cell Counting: The software zips through each image, tallying up live and dead cells to give a straightforward report on how well a drug is working.
- Morphological Analysis: It goes a step further, measuring subtle changes in cell shape and size—tell-tale signs that a cell is under stress or dying.
- Tracking Cell Migration: To understand metastasis, the software can follow individual cells over time, precisely measuring how effectively a drug stops cancer from spreading.
By taking over this painstaking analysis, the software lets researchers screen thousands of compounds in the time it used to take for just a handful. This high-throughput capability is a game-changer, dramatically accelerating the drug discovery pipeline and getting new treatments to patients faster.
Clinical Diagnostics and Pathology
Think of pathologists as the detectives of the medical world. They examine tissue samples (biopsies) under a microscope to diagnose diseases, relying on years of experience to interpret what they see. It's an incredible skill, but it can be subjective and incredibly labor-intensive. Now, digital pathology, supercharged by image analysis software, is bringing a new level of precision to the field.
Once a biopsy slide is digitized, it becomes a huge digital file that software can analyze with perfect objectivity. Take tumor grading, for example. The software can scan the entire sample and count every single mitotic figure (a cell caught in the act of dividing)—a crucial clue to how aggressive a cancer is.
A study found that AI-powered analysis of breast cancer biopsies could hit an accuracy rate of 99.5%, showing just how powerful these tools can be in a pathologist's hands. It’s not about replacing the expert; it's about giving them an incredibly reliable tool to boost their confidence and make diagnoses more consistent.
This approach means a tumor grade from a hospital in one city is directly comparable to one from another, paving the way for more standardized and dependable patient care.
Materials Science and Engineering
Let's shift gears from biology to engineering. The core principles of image analysis are just as critical here. Whether you're designing jet engines or medical implants, you have to understand the microscopic structure of your materials. A tiny crack, a hidden pore, or an uneven mix of particles can be the difference between success and catastrophic failure.
Imagine an aerospace engineer working with a new, lightweight alloy. Using an electron microscope, they capture images deep inside the material's structure. The image lab software then gets to work, automatically handling critical tasks like:
- Grain Size Measurement: It analyzes the size and shape of the tiny crystalline grains in the alloy, which directly relates to its strength and toughness.
- Porosity Analysis: The software hunts for and measures any microscopic voids or pores that could become weak points under stress.
- Fiber Orientation: For composite materials, it can measure the exact alignment of reinforcing fibers—a vital factor for ensuring the final part is as strong as it needs to be.
This kind of quantitative data gives engineers the feedback they need to perfect their manufacturing processes and design materials that are safer, stronger, and more reliable than ever before.
Agriculture and Environmental Monitoring
Even the food on our tables has a connection to image analysis. Modern farming increasingly relies on drones and satellites to get a bird's-eye view of croplands. These images are packed with information about crop health, but trying to sort through it all by hand would be an impossible task.
This is a perfect job for image lab software. By processing multispectral images that capture light beyond what we can see, the software can:
- Detect Plant Stress: It can spot areas where crops are suffering from a lack of water or nutrients, often long before the problem is visible to the naked eye.
- Estimate Crop Yield: By analyzing plant density and overall health, the software can generate surprisingly accurate predictions of the final harvest.
- Map Weed Infestations: It can tell the difference between crops and weeds, allowing farmers to apply herbicides with surgical precision, which saves money and is better for the environment.
By turning aerial photos into detailed crop health maps, this technology is helping farmers work smarter, boost their yields, and embrace more sustainable practices.
Getting Your Analysis Workflow Dialed In

Getting the right image lab software is only the first step. The real magic happens when you build a smart, repeatable workflow that turns scattered analysis into a high-powered system for churning out quality data. It’s all about being methodical from the moment you capture that first image.
This whole process kicks off with something that sounds basic but is absolutely essential: systematic data management. Think of it like a chef prepping their station before a dinner rush. Without that initial organization, you're just setting yourself up for chaos down the line.
You need a strict protocol for how every digital asset is handled. This is the bedrock of reliable analysis, and it's what saves you from massive headaches when you have to revisit a project months later.
Laying the Groundwork with Tidy Data
Good data management isn't rocket science, but it does demand consistency. A few smart habits will keep your projects from spiraling out of control and ensure your data remains trustworthy.
- Consistent File Naming: Come up with a standard naming convention and treat it as law. Bake key details right into the filename—date, experiment ID, sample number, and imaging conditions.
- Logical Folder Structures: Create a clear folder hierarchy for your projects. A great starting point is to have separate folders for raw images, processed images, analysis results, and final figures for publication.
This kind of discipline means anyone on your team can jump into a project and find what they need without having to read your mind.
A well-managed workflow doesn't just save time; it ensures scientific rigor. It's the framework that makes your results reproducible, a cornerstone of credible research.
The need for organized systems like these is only getting bigger. The laboratory informatics market was valued at USD 3.8 billion in 2024 and is expected to climb to USD 6.24 billion by 2029. This boom is fueled by tools that help labs handle massive datasets and collaborate more effectively. You can read more about the laboratory informatics market's rapid expansion on Open PR.
Standardizing Your Analysis with Automation
Once your data is in order, the next move is to standardize the analysis itself. This is where you take human error and inconsistency out of the equation by building automated analysis pipelines—often called macros or scripts.
Think of a macro like a recorded recipe that the software follows perfectly every time. It hits every step in the exact same order with the exact same settings for every image, from background subtraction to object segmentation and measurement.
This automation is a game-changer for two main reasons. First, it guarantees that the differences you see in your results are from genuine biological or material variations, not because you processed one image a little differently than another. Second, it saves an incredible amount of time, letting you fly through large datasets.
Finally, no automated workflow is trustworthy without validation. Always, always run quality control checks. Manually review a sample of the software’s output. Does the segmentation look right to your expert eye? This final step confirms your pipeline is spitting out accurate data and keeps the integrity of your research intact.
Got Questions? We've Got Answers
Stepping into the world of image analysis software can feel a little overwhelming, especially when you're trying to figure out what tools you actually need. Let's tackle some of the most common questions that pop up.
Isn't This Just a Fancy Version of Photoshop?
It's a great question, but the two are fundamentally different tools built for completely different jobs. Think of it this way: Photoshop is an artist's brush, designed to make images look beautiful or compelling. It’s all about aesthetics and creative expression.
Image lab software, on the other hand, is a scientist's microscope or measuring tape. Its entire purpose is to pull objective, quantifiable data from an image. You're not trying to make a cell look "better"; you're trying to precisely measure its size, count its components, or quantify its brightness. It's about data, not design.
Do I Need a Supercomputer to Run This?
That really depends on what you're throwing at it. If you're doing straightforward 2D image analysis, most modern laptops will handle it just fine.
But the game changes when your data gets complex.
If you're working with massive 3D datasets, high-resolution microscope scans, or deep learning models, then yes, you'll need more horsepower. A strong CPU, a dedicated graphics card (GPU), and plenty of RAM (at least 16GB) become essential. Without them, you'll spend more time waiting for your computer to catch up than doing actual research.
Can I Really Trust Free, Open-Source Software for Serious Research?
Absolutely, and you'd be in good company. Platforms like ImageJ/Fiji are cornerstones of the scientific community for a reason. Their code is open for anyone to inspect and validate, which builds an incredible amount of trust and reliability.
These aren't just hobby projects. They're backed by a global community of scientists who build, share, and peer-review plugins for almost any analysis task imaginable. Countless major scientific breakthroughs were made possible by these powerful—and completely free—tools.
At PYCAD, we focus on integrating sophisticated AI into medical imaging to make your analysis more powerful and precise than ever before. To see how our custom solutions can advance your work, check us out at https://pycad.co.