Think of imaging analysis software as a digital magnifying glass and measuring tool, all rolled into one. It’s what lets medical and research experts look beyond just the picture—whether it’s an MRI, CT scan, or microscope slide—and into the quantifiable data hidden within.
What is Imaging Analysis Software, Really?
At its heart, this software is about transforming raw visual data into something measurable and actionable. A standard image viewer is like a digital lightbox; it lets a radiologist look at an X-ray. Imaging analysis software, on the other hand, is a full-blown scientific toolkit. It gives professionals the power to dissect, measure, and quantify what they see, turning a subjective visual assessment into objective, data-driven facts.
Let’s use an analogy. Simply looking at a brain MRI shows you the structure. But analyzing it with specialized software allows a doctor to precisely measure the volume of a tumor, track its growth over several months, or even quantify the specific amount of tissue loss in a patient showing signs of Alzheimer's. This is the crucial leap from simple observation to true quantification, and it's a cornerstone of modern medicine.
From Pixels to Precise Data
The main goal here is to pull out meaningful information that the human eye might miss or can't interpret with perfect consistency. It’s not about replacing the expert, but arming them with better tools.
So, how does it do that? The software typically performs several key functions:
- Identification: It can automatically flag potential issues, like a suspicious-looking lesion or a hairline fracture.
- Segmentation: This is like digitally outlining a specific object of interest—isolating an organ, a tumor, or even a group of cells from the rest of the image.
- Quantification: It measures specific attributes like size, volume, shape, or density. This provides concrete numbers that can be used for diagnosis and tracking progress.
This ability is a huge driver of progress in healthcare. In fact, the medical imaging software market is expected to grow from USD 8.13 billion in 2025 to a massive USD 13.93 billion by 2033, which is a growth rate of almost 7% each year. This boom is happening because the software makes diagnostics in hospitals and labs so much sharper, especially now that AI is helping professionals sort through incredibly complex cases. For a deeper dive into these numbers, Straits Research offers detailed market analysis.
The magic is in turning pictures into hard data. Imaging analysis software gives clinical decisions an objective foundation, which cuts down on guesswork and boosts diagnostic confidence.
To better understand these core capabilities, let's break them down.
Core Functions of Imaging Analysis Software
The table below summarizes the primary tasks that modern imaging analysis software is built to handle, turning a simple image into a rich source of data.
| Function | Description | Primary Benefit |
|---|---|---|
| Image Enhancement | Adjusting contrast, brightness, and sharpness to make features easier to see. | Improves visual clarity for the human eye and prepares images for automated analysis. |
| Object Identification | Automatically detecting and highlighting specific features like cells, lesions, or fractures. | Speeds up the review process and reduces the chance of missing critical details. |
| Segmentation | Digitally isolating a specific region of interest (e.g., an organ or tumor) from its background. | Allows for precise measurement and analysis of a specific structure without interference. |
| Quantification | Measuring attributes like size, volume, shape, texture, or intensity. | Provides objective, reproducible data for diagnosis, treatment planning, and research. |
| 3D Visualization | Reconstructing 2D image slices (from CT or MRI) into a 3D interactive model. | Offers a more intuitive and comprehensive understanding of spatial relationships in anatomy. |
These functions work together to create a detailed, data-backed picture of what's happening inside a patient or a research sample.
Why This Matters for Diagnosis and Research
Ultimately, the real value of this software is how it supports evidence-based medicine. By delivering consistent and repeatable measurements, it helps standardize how conditions are diagnosed across different doctors and hospitals.
For researchers, the impact is just as significant. It automates the tedious work of analyzing thousands of images, a task that would be practically impossible for a human to do manually with any speed or consistency. This blend of precision, objectivity, and efficiency is what makes imaging analysis software such a vital tool. It empowers professionals to make smarter, more informed decisions that directly lead to better patient outcomes.
Essential Features of Modern Imaging Analysis Tools
When you're looking at imaging analysis software, you'll quickly find that not all platforms are built the same. A basic viewer might let you see an image, but a truly powerful tool is packed with non-negotiable features that transform those static pictures into rich, dynamic datasets. These capabilities are the real engine behind modern diagnostics and research, giving clinicians and scientists the depth they need to make decisions with confidence.
Think of these core features as a practical checklist. But more than just ticking boxes, it's about understanding why each feature matters and how it plugs into a more accurate and efficient workflow. From building interactive 3D models to automating tedious work, these are the components that separate a simple viewer from a true analytical powerhouse.
Advanced Visualization and Reconstruction
The first thing that usually grabs your attention is 3D visualization. Medical scans like MRIs and CTs are essentially captured as a stack of flat, 2D slices. Good software can take that stack and stitch the slices together, creating a fully interactive, three-dimensional model of an organ, bone, or network of blood vessels.
This is far more than just a "wow" factor. Imagine a surgeon planning a delicate operation. Being able to virtually rotate a patient's brain or heart gives them an intuitive feel for the anatomy that a flat image could never provide. It helps them see spatial relationships, spot potential roadblocks, and map out their approach with incredible precision—all before making a single incision.
Automated Segmentation and Object Detection
Automated segmentation is probably the single biggest time-saver. Think of segmentation as drawing a highly precise digital outline around a specific structure you care about—a tumor, a lesion, or even a particular cluster of cells. Doing this by hand, slice by slice, across hundreds of images is painstakingly slow and notoriously inconsistent from person to person.
Modern software uses sophisticated algorithms to do this job automatically in a matter of seconds. The payoff is twofold:
- Consistency: The software uses the exact same rules every single time, which gets rid of the natural variability between different human operators.
- Efficiency: This frees up hours of an expert's day, letting them focus on interpreting the results and making a diagnosis instead of just clicking and tracing.
In high-volume labs where hundreds of scans are processed daily, this kind of automation is a game-changer. It makes the entire analysis process not only faster but also much more reliable and reproducible.
By automating the most repetitive tasks, a good imaging analysis platform doesn't just make work faster—it makes the resulting data more reliable and objective. This shift is fundamental to scaling up research studies and standardizing clinical evaluations.
Robust Quantification Tools
Once you’ve isolated a structure through segmentation, the next step is to measure it. This is where robust quantification tools come in—they are the heart of turning pictures into hard data. These are the platform's digital rulers, calipers, and calculators that pull objective measurements directly from the visual information.
Common quantification tools let you measure:
- Volumetrics: Calculating the exact volume of a tumor is critical for tracking how well a cancer patient is responding to treatment.
- Morphometry: Measuring the shape, size, and texture of cells or lesions helps characterize them.
- Intensity Analysis: Quantifying the brightness or signal intensity in a specific spot can reveal tissue health or, in PET scans, show metabolic activity.
These numbers provide the objective proof needed to track a disease or see if a new drug is working. Instead of a radiologist simply saying a tumor "looks smaller," they can state that its volume has decreased by 28%. That level of precision is indispensable.
Seamless System Interoperability
Finally, no software works in a vacuum. A top-tier imaging analysis software has to play nicely with the rest of the hospital's IT infrastructure. This integration hinges on its ability to speak the universal languages of medical data.
The two most important standards are:
- DICOM (Digital Imaging and Communications in Medicine): This is the global standard for how medical images are shared, stored, and viewed. DICOM compliance ensures the software can talk to MRI machines, CT scanners, and the hospital's main image archive (PACS).
- HL7 (Health Level Seven): This standard handles the exchange of all other clinical and administrative data. It's what allows the analysis software to connect with a patient's Electronic Health Record (EHR), automatically linking imaging results to the right patient file.
Without this kind of interoperability, the software becomes a data island, forcing staff into manual data entry and creating information silos. Seamless integration is the final piece of the puzzle that embeds these powerful analytical tools right into the daily clinical workflow.
AI's Growing Role in Imaging Analysis
Artificial intelligence isn't some far-off concept anymore; it's the engine powering the next generation of imaging analysis software. AI and its cousin, machine learning, are fundamentally changing what's possible for medical experts, working alongside them as an incredibly powerful partner in the diagnostic process.
Think of a seasoned radiologist as a master detective, meticulously searching for clues in a patient's scan. Now, imagine giving that detective a team of brilliant assistants who have memorized every similar case in history. These assistants can instantly highlight tiny, suspicious details and organize all the evidence, helping the detective solve the case with greater speed and confidence. This isn't about replacing the expert; it's about amplifying their expertise.
This shift is creating a huge wave in the market. The global medical image analysis software market, valued at USD 3.6 billion, is expected to more than double to USD 7.97 billion by 2030. This boom is almost entirely driven by AI, with over 70% of new software solutions now built with machine learning. While more than 40% of new setups are cloud-based, integrating them with older hospital systems is still a major roadblock for about 60% of facilities. You can get a full rundown of this growth in this detailed industry analysis.
Automating Detection and Prioritizing Care
One of the most immediate wins with AI is its knack for triage on a massive scale. In a busy hospital, a radiologist might have a worklist of hundreds of scans. An AI algorithm can pre-screen that entire list in minutes, sorting the urgent from the routine.
So, how does that actually work? The AI is first trained on huge libraries of anonymized images where experts have already pointed out the problems. It learns to spot the subtle patterns, textures, and shapes that signal specific conditions.
- Flagging Suspicious Scans: The AI automatically flags images that show signs of a stroke, a pulmonary embolism, or a cancerous nodule.
- Moving Critical Cases Up: These flagged scans are then bumped to the top of the radiologist's worklist, making sure the most critical patients get an expert's eyes on them first.
This automated system acts as a vital safety net. It drastically cuts down the chance that a life-threatening issue will sit unread for hours, which has a direct and positive impact on patient outcomes.
Seeing Patterns Invisible to the Human Eye
Beyond just working faster, AI can perceive things that are simply outside the realm of human vision. Our eyes are great at spotting familiar shapes, but we struggle to quantify subtle, widespread changes in texture or brightness across a complex 3D scan.
Machine learning models, on the other hand, are built for this. They can analyze thousands of data points within an image—a field known as radiomics—to pull out hidden information.
Think of it this way: AI analyzing radiomic data is like a master sound engineer who can isolate every single instrument in a 100-piece orchestra. It hears the subtle harmonies and dissonances that are lost to the untrained ear, giving you a much richer understanding of the entire piece.
In oncology, for example, AI models can analyze the texture of a tumor’s border and its internal structure. These microscopic features, invisible to a radiologist, can be strong predictors of how aggressive the cancer is or how it might respond to a certain drug. This opens the door to a new level of personalized medicine, where treatment is guided by deep insights pulled straight from the scans.
AI as a Powerful Diagnostic Partner
At the end of the day, AI’s role in imaging analysis is that of a collaborator, not a replacement. It takes on the repetitive, data-heavy lifting that people find tedious and time-consuming. This frees up clinicians to focus on what they do best: complex problem-solving, talking to patients, and making well-rounded decisions.
By automating segmentation, measuring changes over time with perfect consistency, and flagging potential issues, AI provides a tireless, objective second opinion. This partnership between human and machine makes the diagnostic process more efficient, more accurate, and ultimately, much better for the patient. The technology empowers experts, giving them deeper insights and greater confidence in their clinical judgment.
How to Choose the Right Imaging Analysis Software
Picking the right imaging analysis software is a foundational decision. It has lasting effects on your workflow, your budget, and ultimately, your diagnostic capabilities. This isn't just about buying a product; it’s about choosing a long-term partner for your clinical or research work. The process needs a structured approach, one that looks past the flashy features to get to the heart of what matters: core functionality, compatibility, and vendor reliability.
A smart evaluation framework helps you cut through the marketing hype and focus on what will actually make a difference for your organization. The goal is to land on a solution that not only meets your current technical needs but can also grow with you. That means scrutinizing everything from the types of scans it supports to its regulatory clearances and the true total cost of ownership.
Start With Your Core Technical Needs
Before you even sit through a demo, you need a crystal-clear picture of your non-negotiables. The most fundamental question is simple: what kind of images will you be analyzing? Different imaging modalities create vastly different data, and the software has to be built to handle your specific requirements.
Your initial checklist should cover these critical areas:
- Modality Support: Does the software work with the images you generate every day? This could be anything from MRI, CT, and PET scans to X-Rays, ultrasound, or even digital pathology slides.
- Analytical Tools: Does the platform have the specific quantification tools you actually need? An oncology center, for example, absolutely needs reliable volumetric measurement for tumors. A neurology lab might prioritize tools for measuring cortical thickness.
- Regulatory Compliance: Is the software cleared for clinical use in your region? This is a big one. For diagnostic work, it typically needs FDA clearance in the United States or a CE mark in Europe. Using non-cleared software for patient diagnosis can open you up to serious compliance risks.
Answering these questions first will quickly shrink your list of potential vendors. It saves you a ton of time and stops you from getting too far down the road with an option that was never going to work in the first place.
Evaluate Deployment and Integration
Next, you have to think about how the software will plug into your existing IT world. This is often where implementations either succeed or fail. A crucial decision point is understanding the core differences between cloud and on-premise deployments, as each model has its own distinct advantages and drawbacks.
Here’s a quick breakdown to help you compare these two primary deployment models.
On-Premise vs Cloud-Based Software Comparison
A comparative look at the two primary deployment models for imaging analysis software to aid in selection.
| Factor | On-Premise Solution | Cloud-Based Solution |
|---|---|---|
| Initial Cost | High (servers, licenses, setup) | Low (subscription-based) |
| Data Control | Complete control over data and hardware | Data hosted by a third-party vendor |
| Maintenance | Managed internally by your IT team | Managed by the vendor (updates are automatic) |
| Scalability | Limited; requires new hardware purchases | High; easily adjust storage and user seats |
| Accessibility | Limited to the internal network | Accessible from anywhere with an internet connection |
The right choice really comes down to your organization's resources, security policies, and future growth plans. A small, agile research lab might thrive with a flexible cloud solution, while a large hospital system might need the absolute control that comes with an on-premise installation.
The chart below shows how different software tools can vary on key metrics. It’s a good reminder that you have to weigh multiple factors, not just the price tag.
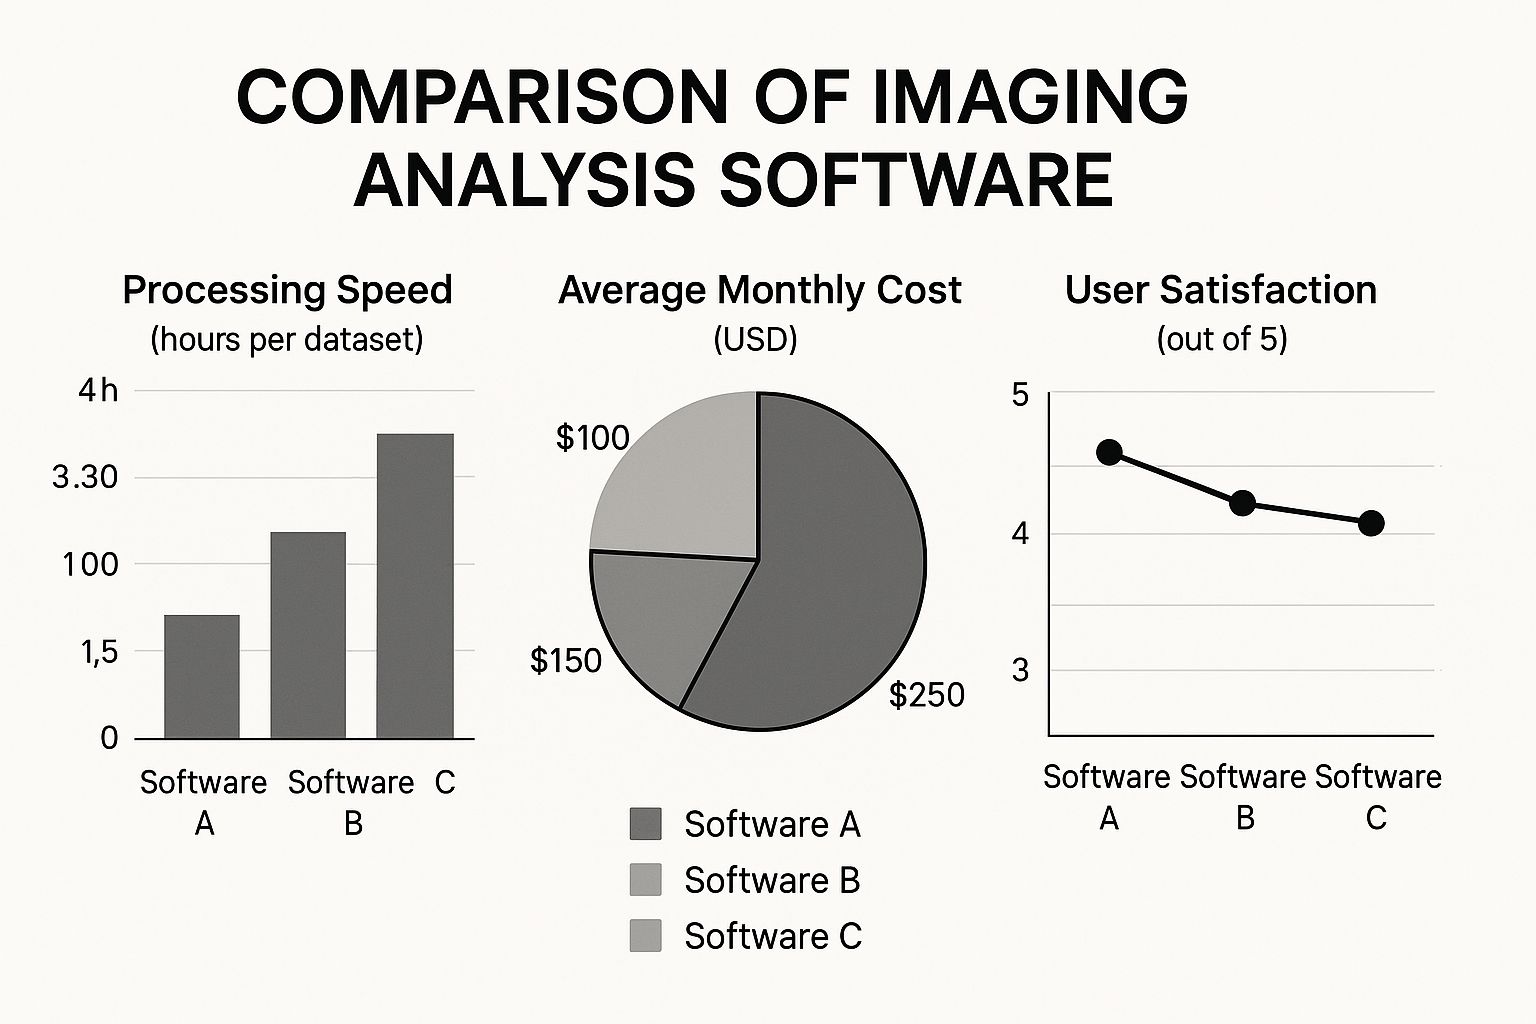
This data just reinforces the trade-offs you have to consider between cost, speed, and overall user experience.
Vet the Vendor and Plan a Pilot Program
Finally, remember that the software is only as good as the company behind it. A fantastic product with terrible support can quickly become a headache you don't need. Before you sign on the dotted line, do your homework on the vendor's reliability and what they offer as a partner.
Try to get clear answers to these questions:
- What is their support like? Do they provide solid training, a responsive helpdesk, and clear documentation? Don't just take their word for it—check reviews and ask for references you can talk to.
- What is their development roadmap? Is the company actively investing in the product, developing new features, and integrating AI? A stagnant platform will fall behind fast.
- Can you run a pilot program? The absolute best way to test software is to use it. A pilot lets your team evaluate the platform with your own data in your own environment. This is where you’ll spot any unforeseen workflow issues or usability problems before it's too late.
Choosing an imaging analysis software is a strategic investment. By carefully evaluating your technical needs, deployment options, and potential vendors, you can make a smart choice that empowers your team and delivers value for years to come.
Real-World Applications Across Medical Specialties

It's one thing to talk about imaging analysis software in theory. But where does the rubber meet the road? Its true value comes to life when you see it at work in clinics and hospitals, directly shaping how doctors care for patients every single day.
This software is more than just a fancy viewer; it’s an indispensable partner for clinicians. It provides the hard, quantitative data needed to back up their expert observations, turning subjective assessments into objective facts. Let’s look at a few examples of how this is happening right now.
Oncology: Precision in Tracking Treatment Response
In oncology, the battle against cancer is measured in millimeters. Before, a radiologist might look at a scan and say, "The tumor looks smaller." Now, imaging analysis software gives them the exact numbers to prove it.
The software uses automated segmentation to trace the precise outline of a tumor on a CT scan and calculate its volume down to the cubic millimeter. After a round of chemotherapy, a follow-up scan can be compared to the original. This allows a clinician to state with certainty that a tumor has shrunk by 34%, providing clear, objective proof that a treatment is effective. That kind of data is crucial for making confident decisions about a patient's care plan.
Neurology: Quantifying Degenerative Brain Changes
In neurology, diseases like Alzheimer's or multiple sclerosis cause subtle, slow-moving changes in the brain that are nearly impossible to track with the human eye alone. This is where imaging analysis really shines.
By comparing a series of MRI scans taken over months or years, the software can accomplish some amazing things:
- Measure the shrinking thickness of the cerebral cortex.
- Calculate changes in the volume of critical brain structures, like the hippocampus.
- Generate color-coded "heat maps" that instantly show where brain tissue has been lost.
This turns a qualitative observation into a hard biomarker for neurodegeneration. It’s essential for monitoring disease progression and serves as a critical endpoint in clinical trials for new dementia treatments.
The real power of this software is its ability to make the invisible visible. It quantifies subtle biological changes over time, giving clinicians a clear, data-driven view of disease progression or recovery that was previously impossible to obtain.
Cardiology: Measuring Cardiac Function and Health
Cardiologists depend on dynamic imaging to see how well the heart is pumping. Instead of just visually estimating its function, analysis software gives them precise performance metrics.
When analyzing a cardiac MRI or an echocardiogram, these platforms can automatically calculate the heart’s ejection fraction—the percentage of blood pushed out of the heart with each beat. A low number is a classic sign of heart failure. This imaging analysis software provides the objective data cardiologists need to diagnose conditions, decide on interventions like pacemakers, and track a patient's recovery after surgery.
These applications are even influencing which imaging tools are used most. While ultrasound is currently the most common, market analysis predicts its share will fall slightly from 31% to 29% by 2025. In its place, the growing need for detailed, quantifiable data is expected to boost MRI’s share from 12% to 14% and CT’s from 15% to 16%. You can dig deeper into these shifting clinical demands in this comprehensive market report on medical image analysis. It’s a clear sign that the software's capabilities are paving the way for the future of medical imaging.
The Future of Imaging Analysis: What's on the Horizon?
The field of imaging analysis is anything but static. New developments are constantly pushing the boundaries of what diagnostic technology can do, shifting the focus from simple detection to predictive insights and truly personalized medicine. Staying ahead of these trends is crucial because they show us where the next big breakthroughs will happen.
We're watching the next generation of imaging analysis software evolve in real-time. This evolution is being shaped by fresh thinking around data privacy, virtual patient models, and a more complete, holistic view of diagnostics.
Advancing AI with Federated Learning
One of the biggest hurdles in training smarter AI has always been data access. How do you get enough diverse, high-quality data to build a powerful model without compromising patient privacy? Federated learning provides an elegant answer to this dilemma.
Instead of pulling sensitive patient data from multiple hospitals into one central server, federated learning flips the script. The AI model itself travels to the data. It's like a specialist consultant visiting different clinics; the algorithm trains on the local data behind each hospital's firewall, gathers insights, and then moves on. The crucial part? No patient data ever leaves the institution.
This method completely changes the game:
- Privacy by Design: Patient confidentiality is built into the very core of the process.
- Diverse Data Pools: Models can train on a much broader and more representative set of patient data from around the globe.
- More Robust AI: Training on varied datasets helps build more accurate and less biased algorithms.
Federated learning breaks a major bottleneck in AI development. It allows for global collaboration to build smarter diagnostic tools, all while keeping patient data locked down and secure where it belongs.
The Rise of Medical Digital Twins
Picture this: a surgeon is about to perform a high-stakes operation. But before they ever make an incision on the patient, they practice the entire procedure on a perfect virtual replica of that patient’s organ, built from their unique scans and health data. This is the incredible potential of a medical digital twin.
This isn't just a static 3D model. It's a living, dynamic simulation. An oncologist could use a digital twin of a tumor to test various chemotherapy cocktails, figuring out which one will be most effective with the fewest side effects—all in a virtual environment. It represents a monumental shift from one-size-fits-all protocols to strategies tailored to a single individual.
Integrating Quantitative and Holistic Data
The future of diagnosis is about seeing the whole picture. The next wave of imaging software won't just display images; it will deeply integrate quantitative imaging biomarkers—objective, measurable data pulled directly from scans—into everyday clinical work.
This means a radiologist’s report could include hard numbers tracking a tumor’s response to treatment over time, not just a visual description. Taking it a step further, this imaging data will be fused with other critical information like a patient's genetic profile (genomics), protein data (proteomics), and clinical history. By combining these once-siloed streams of information, clinicians can spot patterns and make predictions that were previously impossible, creating a truly unified view of a patient's health.
Frequently Asked Questions
Getting your head around medical imaging technology can be tricky, especially when you're looking to bring new tools into an established process. Let's tackle some of the most common questions people have about imaging analysis software to clear up its role, value, and what it takes to get started.
What Is the Difference Between PACS and Imaging Analysis Software?
It helps to think of it like this: your PACS (Picture Archiving and Communication System) is the hospital's ultra-secure, digital filing cabinet for medical images. Its job is to store, organize, and let you pull up scans from your CT, MRI, and X-ray machines. It’s the home base for all your imaging data.
Imaging analysis software, on the other hand, is the specialist's toolkit you use after you've pulled a file from that cabinet. It takes an image from the PACS and lets you do the heavy lifting—like precisely measuring a tumor, calculating blood flow in a vessel, or creating a 3D model you can spin around.
So, in a nutshell: PACS handles image storage and access. Analysis software is where the deep, quantitative work happens.
How Does This Software Improve Patient Outcomes?
The impact on patient care is very real and happens in a few key ways. For starters, it enhances diagnostic accuracy, giving clinicians the tools to spot subtle signs of disease that the human eye might miss. Catching things earlier almost always leads to better treatment options.
It also introduces objective data into the equation. Instead of just observing if a lesion looks bigger, you can measure it down to the millimeter and track its growth over time. This makes it much easier to see if a treatment is working and adjust the care plan based on solid evidence.
Finally, by automating many of the manual, time-consuming measurement tasks, it simply speeds things up. Patients get answers faster, and radiologists have more time to spend on the most challenging cases that require their full expertise.
The core benefit is the shift from subjective observation to objective measurement. This strengthens diagnostic confidence, reduces variability between clinicians, and provides a solid, data-driven foundation for making critical care decisions.
Is Imaging Analysis Software Difficult to Implement?
The difficulty really depends on the software and your existing setup, but the biggest hurdle is almost always integration. The new software has to talk to your other systems, primarily the PACS and your Electronic Health Record (EHR), without any hitches. The key is to look for a solution built with interoperability in mind, using standards like DICOM and HL7.
Many modern, cloud-based platforms can make this much easier by cutting down on the need for new servers and on-site IT support. But no matter the solution, a successful rollout always comes down to good planning. You'll need a clear strategy, a dedicated team, open communication with your vendor, and proper training for the clinical staff to make the transition smooth.
Ready to integrate intelligent analysis into your medical imaging workflow? PYCAD specializes in providing end-to-end AI solutions, from data annotation and model training to full deployment, helping you unlock new levels of diagnostic precision and efficiency. Discover how we can advance your capabilities.