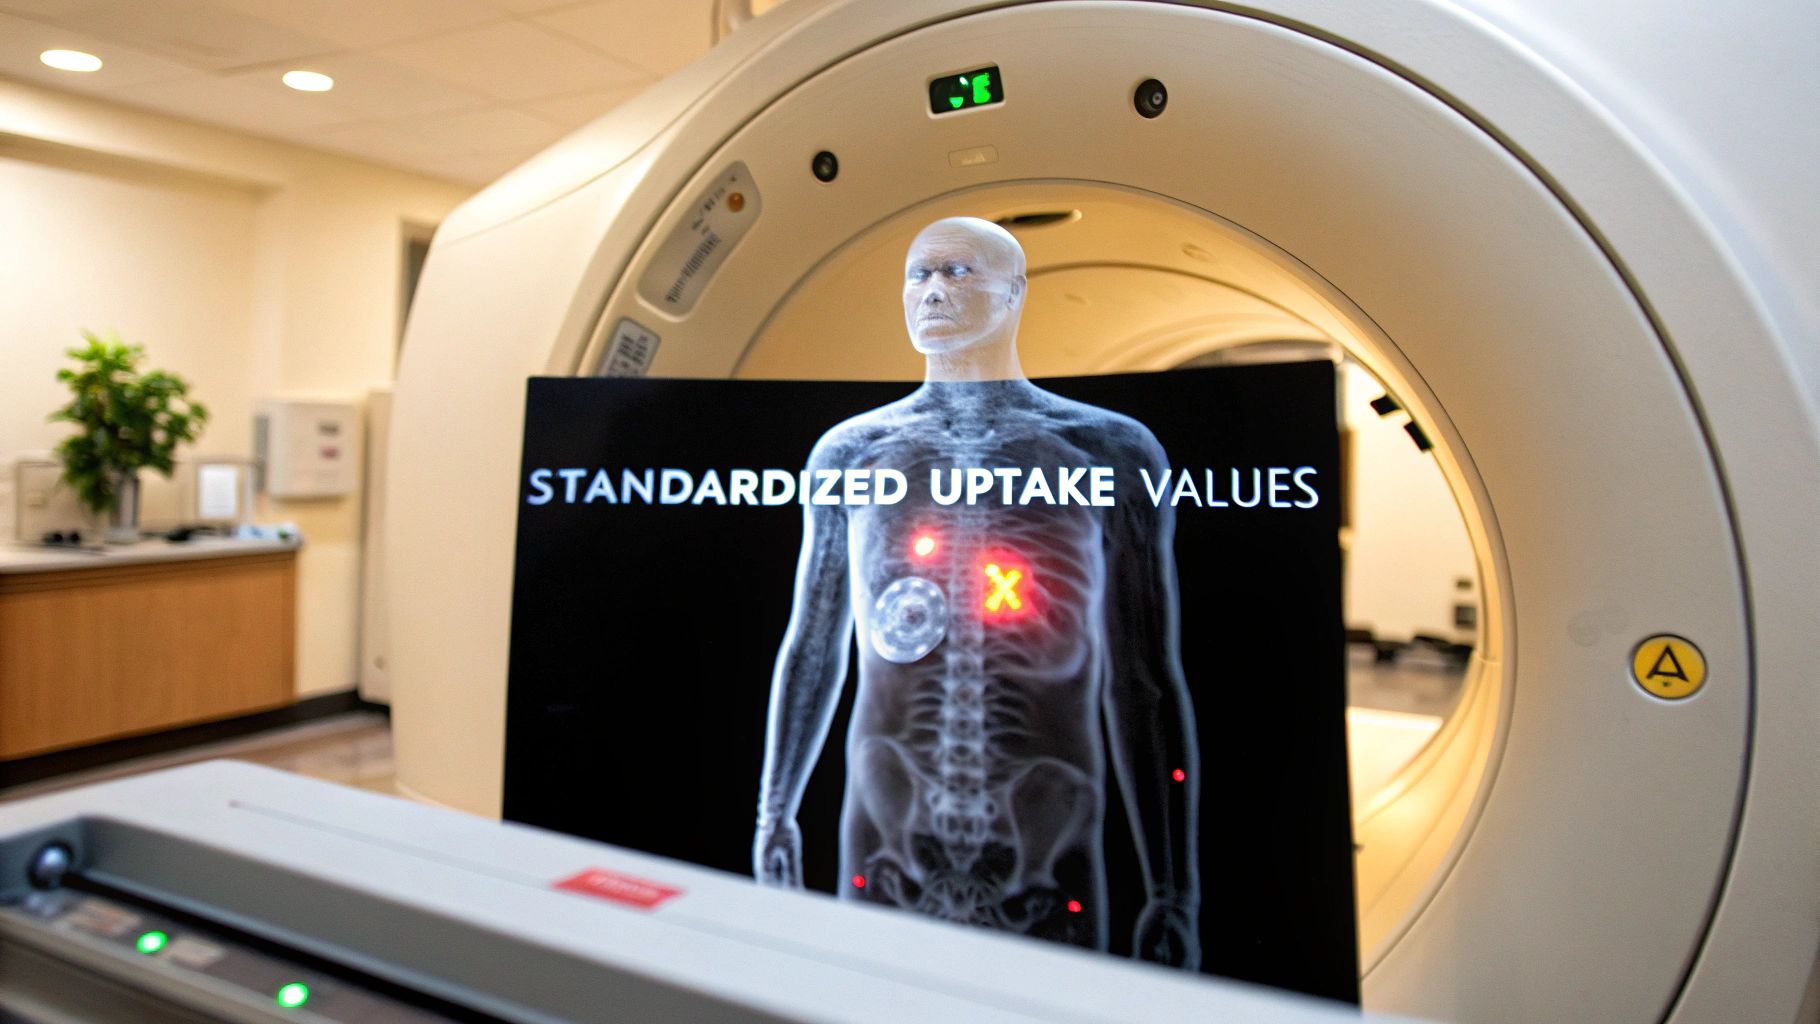
In the world of medical imaging, we often rely on what we can see. But what if we could quantify what we're seeing? That's where the Standardized Uptake Value (SUV) comes in. Think of it as a metabolic weather map of the body, highlighting 'hotspots' where cells are burning through energy at an unusual rate—a potential sign of disease. This one number transforms a complex PET scan into clear, actionable data.
Decoding the Language of PET Scans
At its heart, a PET (Positron Emission Tomography) scan gives us a window into the body's metabolic processes. It all starts with an injection of a radioactive tracer—most commonly [18F]fluorodeoxyglucose (FDG), which is essentially a type of sugar that our cells love to eat.
Cancer cells and areas of inflammation are incredibly hungry. They consume this sugar tracer far more rapidly than healthy tissues. The PET scanner then picks up the signals from the tracer, creating a detailed map showing exactly where it has accumulated.
While these images are visually powerful, just looking at them can be subjective. One radiologist might see a "bright spot," while another sees a "very bright spot." This is where the SUV becomes so important. It adds a crucial layer of objective data to what we see, moving us from a gut feeling to a precise measurement.
The Core Concept of SUV
The Standardized Uptake Value tells us the concentration of the radioactive tracer in a specific area we're interested in. But it's more than just a raw count. It's a calculated ratio that accounts for variables like the patient's body size and the exact dose of the tracer they received. This "standardization" is the key to making comparisons meaningful.
This is the formula used to calculate it:
This calculation ensures the final SUV is a normalized value, making it a much more reliable metric when comparing different patients or tracking changes in the same patient over time.
Ultimately, the SUV helps answer a critical question: "Just how metabolically active is this tissue?" A higher SUV points to greater metabolic activity. It’s a globally recognized metric in nuclear medicine, mathematically expressed as the ratio of radioactivity in a tissue to the injected dose spread across the body's mass. You can find more details about this foundational metric on the Standardized Uptake Value Wikipedia page.
To help clarify these concepts, here’s a quick summary of the core ideas behind SUV.
Key SUV Concepts at a Glance
| Concept | Brief Explanation | Clinical Importance |
|---|---|---|
| Metabolic Activity | Measures how quickly cells consume energy (glucose). | High activity can signal cancer, inflammation, or infection. |
| Radioactive Tracer (FDG) | A sugar-like substance that emits detectable signals. | Accumulates in highly metabolic "hotspots." |
| Standardization | Adjusts for patient weight and injected dose. | Allows for reliable comparisons across different scans and patients. |
| Quantitative Value | Provides a specific number, not just a visual impression. | Turns a subjective image into objective, measurable data for diagnosis and monitoring. |
This table shows how these individual pieces come together to make SUV a powerful clinical tool.
Why Standardization Matters: Without it, comparing a PET scan from a 200-pound person to one from a 120-pound person would be like comparing apples and oranges. The SUV calculation levels the playing field, creating a consistent baseline for making clinical judgments.
By providing this objective number, the SUV plays a central role in several key areas of patient care:
- Diagnosis: It helps us differentiate between benign (non-cancerous) and malignant (cancerous) growths.
- Staging: We can better determine the extent of a known cancer and see if it has spread.
- Treatment Monitoring: It allows us to see if a tumor is responding to therapy, often long before we could detect a change in its physical size on other types of scans.
The Journey to Quantitative PET Imaging
To really get why the Standardized Uptake Value (SUV) is such a big deal, you have to rewind the clock. Before we had this number, PET scans were almost entirely a visual game. Radiologists would peer at these early, often grainy images, and their expert eyes had to interpret every shade and hotspot.
It was a revolutionary technology for its time, but it had an obvious ceiling. Calling a tumor "moderately bright" or "highly active" is subjective, isn't it? It left too much room for interpretation. Comparing scans from two different patients—or even follow-up scans from the same patient—was a huge challenge. The medical community knew it needed to shift from visual guesswork to hard, objective data.
The mission was clear: make PET imaging less of an art form and more of a repeatable science. This meant finding a way to translate the brightness of a pixel into a solid number that meant the same thing every single time, no matter the patient or the clinic. This is the exact problem the SUV was created to solve.
From Pictures to Precision
Getting from fuzzy images to precise metrics took decades of work, fueled by leaps in both technology and our understanding of how the body works. The first PET scanners gave us a glimpse into metabolic processes, but the images just weren't consistent enough for precise measurements.
The real breakthrough came when researchers and engineers tackled the root causes of all that variability. They had to figure out how to account for differences in patient size, the exact amount of radioactive tracer injected, and even the quirks of individual scanners. This push for consistency paved the way for a standardized method.
A huge step forward was developing corrections for signal attenuation—the way signals weaken as they travel through body tissue. Nailing this was critical. It ensured that a bright spot on a scan was truly due to high metabolic activity, not just because it was closer to the scanner's detectors.
The Pioneers of PET Quantification
The story of the SUV is tied directly to the history of PET itself, which started taking shape back in the 1960s. The late 1970s and early 1980s were a particularly crucial period. Pioneers like Phelps, Hoffman, and Kuhl were developing the first commercial PET scanners, like the ECAT I, and working with the FDG tracer we still use today. These early steps were essential for quantitative analysis to even be possible. You can read more about the foundational history of PET imaging to see how far we've come.
All this hard work eventually led to the concept of the SUV. It's a surprisingly simple yet powerful ratio. By taking the tracer concentration measured in a specific tissue and dividing it by the total injected dose (normalized for the patient's body weight), they created a metric that was far less influenced by those outside variables. It was a game-changer.
By standardizing the measurement, the SUV provided a common language for clinicians worldwide. A specific SUV number could now be discussed with a shared understanding of its clinical meaning, making multi-center trials and collaborative research far more effective.
This wasn't just a tech upgrade; it was a complete shift in thinking.
- From Subjective to Objective: We moved from saying "it looks bright" to stating "the SUVmax is 8.2."
- From Qualitative to Quantitative: We stopped just describing images and started measuring them.
- From Isolated to Comparable: We could finally track disease and treatment response consistently across different scans, hospitals, and even countries.
Understanding this history is so important because it shows the SUV isn't just medical jargon. It's the result of decades of scientific effort to make medical imaging more accurate, reliable, and powerful in the fight against diseases like cancer. The development of the standardized uptake value was a massive leap toward truly data-driven medicine.
How Standardized Uptake Values Are Calculated
To truly get a feel for the power of standardized uptake values, we have to pop the hood and see how this critical number comes together. At first, the formula might look a little intimidating, but it’s actually built on a simple, logical idea: creating a fair comparison of metabolic activity from one patient to the next.
Think of it like calculating a car's fuel efficiency in miles per gallon. It standardizes performance so you can meaningfully compare a tiny sedan to a massive truck. The goal with SUV is to measure how much of the injected radioactive tracer has piled up in a specific area of tissue. Then, we normalize that measurement against the total amount of tracer injected, factoring in the patient's body size. This crucial step ensures the final value isn't thrown off just because a patient is larger or received a slightly different dose.
The Basic SUV Formula Explained
The most common calculation is for the Standardized Uptake Value based on body weight, often noted as SUVbw. It’s a straightforward ratio. You take the measured radioactivity in a specific region of interest (ROI) and divide it by the total injected dose, which has been spread throughout the patient's entire body mass.
This gives you a standardized metric instead of just a raw radioactivity count. This visual breaks down how the key inputs feed into the final calculation.
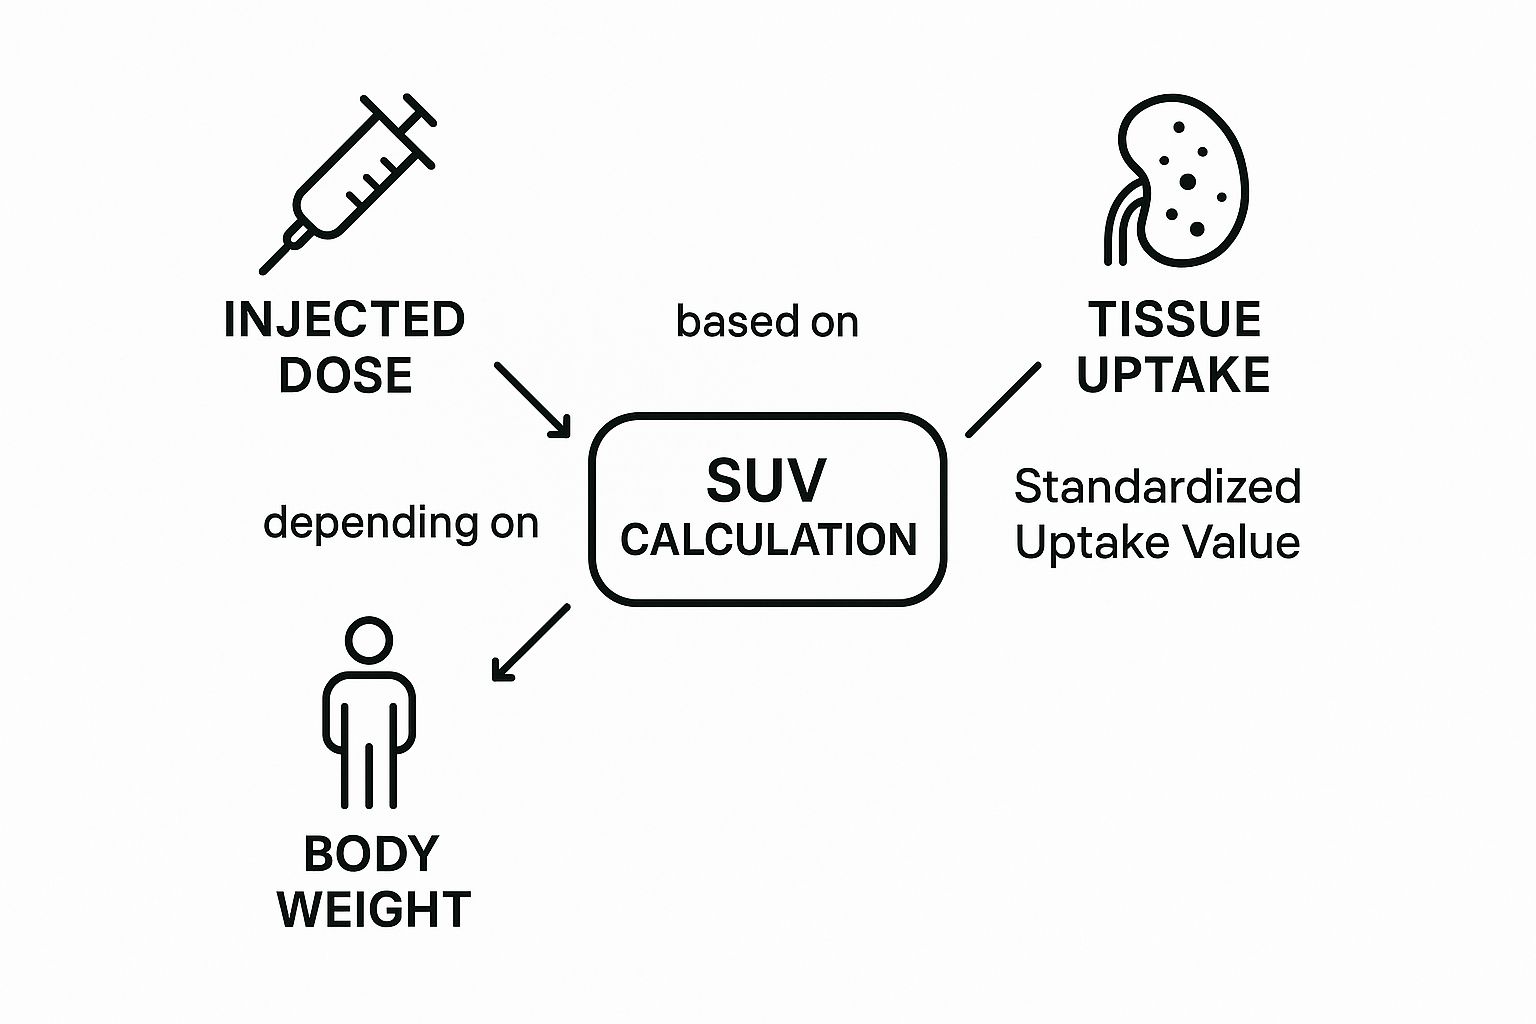
As you can see, the final Standardized Uptake Value is a direct result of balancing the tracer concentration in the tissue against the patient's unique physiological factors.
Different Flavors of SUV Measurements
While that basic formula is the foundation, clinicians rarely stop there. A single "hotspot" on a PET scan is made up of many individual pixels, each with its own uptake value. To get a more nuanced picture, we use several variations of the SUV to summarize this data in different ways.
Here are the three most common types you’ll run into:
- SUVmax (Maximum SUV): This is the value of the single brightest, most intense pixel within the region of interest. It's fantastic for spotting even tiny pockets of high metabolic activity, but it has a weakness—it can be overly sensitive to random image noise, which can sometimes create an artificially high reading.
- SUVmean (Mean SUV): This represents the average SUV of all the pixels within the entire defined region. It gives you a good general sense of the lesion's overall activity, but its accuracy depends heavily on drawing the boundaries of the ROI just right. If the outline is too wide, the average can get watered down.
- SUVpeak (Peak SUV): Often seen as the best of both worlds, SUVpeak is the average SUV within a small, fixed-size sphere (usually about 1 cubic centimeter) centered on the most active part of the lesion. This approach is more stable and less prone to noise than SUVmax, making it a highly reproducible and often preferred metric for tracking how a tumor is responding to treatment over time.
For instance, a clinician might rely on SUVmax to confirm the presence of a tiny, suspected metastasis. But for a longitudinal study tracking how a large tumor responds to chemotherapy over several months, the more robust and reproducible SUVpeak is almost always the better choice.
Essential Adjustments for Greater Accuracy
The standard body weight calculation (SUVbw) is the workhorse, but it isn’t perfect. The issue is that adipose (fat) tissue doesn't really absorb the FDG tracer like other tissues do. In patients with a higher body mass index (BMI), the injected dose gets distributed over a much larger weight, which can artificially push the SUVbw value down. This could potentially hide significant metabolic activity.
To get around this, two other normalization methods are used to paint a more accurate metabolic picture.
- SUVlbm (Lean Body Mass): This calculation adjusts the SUV based on the patient's lean body mass, which strips out the fat. It gives a much better reflection of tracer uptake in the tissues that are actually metabolically active. This is especially helpful when comparing patients with very different body compositions. Calculating lean body mass involves its own formulas that typically use the patient's height, weight, and gender.
- SUVbsa (Body Surface Area): Another popular adjustment normalizes the value using the patient's body surface area. Just like SUVlbm, it’s designed to minimize the variability that comes from differences in body size and composition, adding another layer of precision.
Ultimately, choosing the right calculation—whether it's SUVmax versus SUVpeak, or normalizing by body weight versus lean body mass—is all about the clinical context. Each method provides a unique lens for viewing the metabolic data. Understanding these distinctions is what allows for the most accurate interpretation of PET scans and is precisely what makes standardized uptake values such a reliable tool in modern medicine.
Why SUV Measurements Can Be Deceptively Variable
A standardized uptake value isn't a fixed, absolute number. Think of it less like a person's height and more like their blood pressure—a dynamic measurement that can be swayed by a surprising number of variables at any given moment.
Getting a reliable SUV means carefully controlling these factors. For clinicians, knowing what can throw off these numbers is absolutely critical. It’s the only way to be sure that a change in a patient's SUV from one scan to the next reflects a real biological shift in their disease, not just a technical or physiological hiccup.
These influences fall into two main buckets: patient-specific variables and technical factors tied to the imaging process itself.
The Human Element: Patient-Specific Variables
Before a patient even enters the PET scanner, several things can dramatically alter the final SUV reading. The body is a complex, living system, and its state at the time of the scan directly impacts how the FDG tracer gets distributed.
-
Blood Glucose Levels: This is probably the biggest one. High blood sugar competes directly with the FDG tracer for a ride into the body's cells. This competition can lead to a falsely low SUV in tumors, potentially masking a lesion or making it seem less aggressive than it really is. That's why most imaging centers won’t scan a patient with a blood glucose level above 150-200 mg/dL.
-
Diet and Fasting: There's a reason patients are told to fast for at least 4-6 hours before an FDG-PET scan. Eating triggers an insulin release, which shoves glucose (and our look-alike tracer, FDG) into healthy muscle and fat cells. All that "background" uptake can easily obscure the very hot spots we're trying to find.
-
Recent Physical Activity: Strenuous exercise can cause muscles to light up on a PET scan, creating intense signals that can be mistaken for disease. But it's not just a marathon that can cause issues. Even minor activities like chewing gum or talking for a long time can lead to noticeable uptake in the jaw muscles.
A review of F-18 FDG PET/CT scans revealed that a whopping 38% of artifacts—those misleading signals that can confuse a diagnosis—were caused by simple patient motion. Another 26% came from physiological muscle uptake, hammering home just how vital patient prep and stillness are for a clean, accurate reading.
The Machine and the Method: Technical Factors
Beyond the patient's own body, the way the scan is performed introduces another layer of potential variability. Nailing down these technical details is the bedrock of reproducible SUVs, especially when comparing scans from different hospitals or for clinical trials.
Key technical variables include:
-
Uptake Time: This is the precise time between injecting the FDG tracer and starting the scan. It has to be consistent. If a baseline scan is done 60 minutes after injection and a follow-up is done at 90 minutes, you can't reliably compare the SUVs. Tissues continue to absorb the tracer over time, so the numbers will naturally be different.
-
Scanner Calibration: PET scanners need to be meticulously calibrated. Without it, the same person could get different SUV measurements on two scanners, or even on the same machine on different days. Calibration ensures that a specific amount of radioactivity is always translated into the same quantitative value.
-
Image Reconstruction Methods: The raw data from a PET scan is just a stream of numbers. It takes complex computer algorithms to build the final image. Different reconstruction methods can crunch the same raw data and produce slightly different images—and different SUV numbers. For follow-up scans, using the exact same reconstruction parameters is a must.
Now, let's break down some of the most common culprits that can affect SUV measurements.
Common Sources of Variability in SUV Measurements
The table below gives a quick overview of the many factors—both human and technical—that can alter the final SUV number. Understanding these is the first step toward controlling for them.
| Category | Specific Factor | Impact on SUV Measurement |
|---|---|---|
| Patient Physiology | High Blood Glucose | Competes with FDG, leading to falsely low tumor SUV. |
| Insulin Levels (Post-Meal) | Drives FDG into healthy muscle/fat, lowering tumor-to-background contrast. | |
| Body Habitus (Obesity) | Can cause higher background noise, leading to falsely high SUV due to attenuation correction errors. | |
| Inflammation/Infection | Inflammatory cells are metabolically active and can cause falsely high SUV, mimicking malignancy. | |
| Patient Behavior | Recent Strenuous Exercise | Causes intense FDG uptake in muscles, creating artifacts and potentially high SUV in non-target areas. |
| Patient Motion During Scan | Blurs the image, which can lead to an inaccurate (often lower) SUVmax calculation. | |
| Diet (Non-Fasting) | As with insulin, this can decrease the tracer available for tumor uptake. | |
| Technical & Procedural | Inaccurate Patient Weight/Height | Directly skews the SUV calculation, which is normalized to body mass. Can be falsely high or low. |
| Tracer Dose Infiltration | If the tracer leaks outside the vein, the injected dose is wrong, leading to a falsely high SUV. | |
| Inconsistent Uptake Time | Longer uptake times generally lead to higher tumor SUV and lower background activity. | |
| Scanner Calibration Drift | An uncalibrated scanner can cause systemic errors, making all SUVs artificially high or low. | |
| Image Reconstruction Algorithm | Different methods (e.g., OSEM, Q.Clear) can produce SUV values that differ by 10-20% or more. |
Controlling for these variables is not just about ticking boxes; it's about ensuring the final number is a true reflection of the patient's disease.
Biological Factors We Can't Control
While strict protocols can manage most variables, some are just part of our biology. Age, for instance, has a fascinating effect on our baseline metabolic activity.
One major study found that standardized uptake values in normal tissues actually increase significantly during our early years. The blood pool SUVmax climbed from about 1.06 in young children to 1.62 by age 20, with the liver showing a similar trend. This tells us that a "normal" baseline SUV isn't a single number but a moving target that changes as we grow. You can dig into the data yourself in this comprehensive cross-sectional analysis on SUV and age.
By understanding this entire spectrum of variables—from a patient's last meal to the algorithm used to build the image—clinicians can have much greater confidence in what the final SUV number truly means. This meticulous attention to detail is what turns the SUV from a simple measurement into a powerful and reliable tool for guiding patient care.
How SUV Is Used in Modern Oncology

While the math behind standardized uptake values is interesting, what really matters is how they work in the real world. In modern oncology, the SUV is much more than a number on a report; it's a vital tool that guides doctors and patients through the entire cancer journey. From an initial suspicious finding to checking if a treatment is working, this single value gives us a consistent way to measure a tumor's metabolic behavior.
Think of it this way: an oncologist is like a detective investigating a tumor's behavior. The SUV is a key clue, revealing just how "hungry" a lesion is for glucose. This insight helps clinicians make sense of the complex world of cancer care, turning a PET image from a simple picture into a strategic roadmap for treatment.
Pinpointing Malignancy at Initial Diagnosis
One of the first hurdles in oncology is figuring out if a newly discovered lump or nodule is benign or malignant. While a biopsy is the definitive answer, a PET/CT scan with SUV measurements gives us a powerful, non-invasive way to get a pretty good idea. Cancer cells are metabolic engines, gobbling up glucose far faster than normal tissue or benign growths.
This metabolic difference shows up clearly in the SUV numbers. Although there’s no magic number that works for every case, a common rule of thumb is an SUVmax of 2.5. Lesions with a value higher than that are more likely to be cancerous, while those below it are often benign. For example, a lung nodule with an SUVmax of 7.8 is highly suspicious, but one with an SUVmax of 1.2 is much less worrisome. This helps doctors decide who needs an invasive biopsy right away and who can be safely monitored.
By putting a number on metabolic activity, SUV acts as an early warning system. It helps doctors separate the real threats from the background noise, focusing attention where it’s needed most and avoiding unnecessary procedures.
Staging Cancer and Planning Treatment
Once a cancer diagnosis is confirmed, the next crucial step is staging—finding out exactly where the cancer is and how far it has spread. This is where PET/CT and standardized uptake values really shine. A whole-body scan can light up every area of high metabolic activity, showing if the cancer has spread to lymph nodes or distant organs.
A PET scan can spot tiny, active cancer deposits that might be completely invisible on a CT or MRI, which only show anatomy, not function.
- Mapping Disease Extent: A patient diagnosed with breast cancer might have a PET scan that reveals unexpected hotspots in their liver and bones, which immediately changes the cancer's stage and the entire treatment plan.
- Guiding Radiotherapy: Radiation oncologists use this metabolic map to draw up precise treatment fields, making sure they target all the active tumor tissue while protecting healthy organs nearby.
- Informing Surgical Plans: Before an operation, surgeons can use PET imaging to see the true boundaries of a tumor and identify which lymph nodes need to be removed.
Getting this complete picture from the start is absolutely essential for choosing the most effective treatment.
Monitoring Treatment Response
Perhaps the most powerful use of SUV in everyday oncology is tracking how well a treatment is working. In the past, doctors had to wait months to see if a tumor was shrinking on a CT scan—a long, stressful wait for everyone involved.
With SUV, we get answers much faster. A successful treatment will shut down a tumor's metabolism long before the tumor actually starts to shrink. A big drop in a tumor's SUV is one of the earliest and most reliable signs that a therapy is doing its job. For instance, a lymphoma patient might start with a tumor that has an SUVmax of 15. After just two cycles of chemotherapy, a new scan might show that number has plummeted to 3.5.
This kind of rapid feedback is priceless. It reassures the patient and the medical team that they're on the right track. On the flip side, if the SUV stays high or even goes up, it’s a clear signal that the treatment isn't working, allowing the oncologist to switch to a different approach without wasting another moment.
The Future of PET Imaging with AI and Radiomics
Even with the power of standardized uptake values, the process isn't perfect. A lot of it still comes down to human hands and eyes—drawing those regions of interest, interpreting the numbers. This naturally introduces some variability. The next big leap for PET imaging is all about bringing in artificial intelligence (AI) to add a new layer of consistency and insight to our analysis.
AI-driven tools are already starting to take over the time-consuming and often subjective task of tumor segmentation. Imagine an algorithm that can instantly identify and outline the entire metabolically active tumor, rather than a radiologist having to do it by hand. This means that when we calculate values like SUVmean and SUVpeak, we know they're coming from the exact same region on every follow-up scan, making our comparisons much more reliable.
Unlocking Deeper Insights with Radiomics
But AI does more than just make our current methods more consistent; it opens up an entirely new field called radiomics. This is where we go way beyond a single SUV number. Radiomics uses complex algorithms to pull out hundreds of features from a PET image that are completely invisible to us.
Here’s an analogy: a traditional SUV reading is like taking a tumor's average temperature. It's useful, but basic. Radiomics, on the other hand, is like getting a detailed thermal map showing every tiny variation, texture, and pattern across the entire lesion. This kind of deep dive can tell us a lot about the tumor’s underlying biology.
Radiomics is all about extracting a massive, rich dataset from the medical images we already have. These "radiomic features" can quantify things like tumor heterogeneity—basically, the mix of different cell types within a tumor. This is a huge deal, as heterogeneity is often linked to treatment resistance and more aggressive cancers.
This level of detail is pushing us into a new era of diagnostics. We're moving from simply knowing a tumor is "hot" to understanding why it's hot and what that means for a patient's future.
AI and the Path to Personalized Medicine
When you combine AI with radiomics, you get a powerful tool for making cancer care far more predictive and personal. By finding correlations between specific radiomic signatures and how patients actually do, researchers are building models that can help us see a tumor's future.
This could change the game in a few key ways:
- Predicting Treatment Response: An AI model could spot a specific texture pattern in a PET scan that strongly suggests the tumor will respond well to immunotherapy, helping doctors choose the right tool for the job.
- Assessing Tumor Aggressiveness: Other radiomic features might act as red flags, signaling a more aggressive cancer that needs a more intensive treatment plan right from the get-go.
And the impact of AI isn't limited to just analyzing images. It's also reshaping how we handle documentation and data entry, with major strides in tools like AI voice recognition in healthcare. By weaving these intelligent systems into the entire diagnostic workflow, we're not just making things more efficient; we're making them smarter. AI is building on the foundation that SUV created, giving us a much deeper, data-first understanding of disease.
Unpacking Common Questions About SUV
It’s natural to have questions about the standardized uptake value (SUV) when you’re dealing with PET imaging. This number is a cornerstone of PET interpretation, so getting a solid grasp on what it means—and its limitations—is crucial for everyone involved.
Let’s tackle some of the most common questions that come up.
The whole point of using an SUV is to take something visual and turn it into something measurable. It gives us a semi-quantitative number that reflects how metabolically active a tissue is, letting us compare a suspicious spot to normal tissue, see if a tumor is responding to treatment over time, or even compare scans from different facilities (as long as everyone follows the same playbook).
Does a High SUV Automatically Mean Cancer?
A high SUV definitely gets our attention, but it's not a surefire sign of cancer. While cancerous tumors are famous for their high metabolic activity—often showing an SUV greater than 2.5—other things can cause a PET scan to light up just as brightly.
Think of it this way; anything that makes your cells work overtime can increase radiotracer uptake. This includes:
- Inflammation: An inflamed joint or organ is a hotbed of cellular activity.
- Infection: Your body sends a flood of cells to fight infection, and that process burns a lot of energy.
- Healing: The body's repair crew is hard at work after surgery or an injury, which also shows up on the scan.
A radiologist's real skill lies in putting that SUV number into context. They look at the patient's medical history, the exact location of the high uptake, and the overall pattern across the entire scan before making a judgment.
An elevated SUV is a critical piece of the puzzle, but it’s not the whole picture. It flags an area for a closer look and helps guide what to do next, but it always needs to be paired with clinical expertise to figure out what’s really going on.
Why Are Strict Protocols for Measuring SUV So Important?
When it comes to SUV, consistency is king. Without strict, standardized protocols, the numbers are basically meaningless for comparison. So many little things can throw off the final value, making it impossible to confidently compare a scan from June to one in September.
Imagine trying to weigh yourself on a different, uncalibrated scale every day—you wouldn't trust the results. It's the same with SUV. Factors like how long a patient has been fasting, their blood sugar level at scan time, or the precise timing between the tracer injection and the scan can all nudge the SUV up or down. Even the technical settings on the scanner itself have a major impact.
By standardizing every step, we make sure that a change in a patient’s SUV reflects a real biological change, not just a random fluctuation in the measurement process.
At PYCAD, we're focused on building AI tools that bring a new level of consistency and accuracy to medical imaging. See how our solutions can help add more precision to your own diagnostic work.