
Anyone who has read a coronary angiogram knows the problem the format builds in. The vessels are a 3D tree squashed onto a 2D detector. Branches overlap, a segment pointing at the tube looks short, and the cardiologist rebuilds the geometry in their head from two or three views shot at different gantry angles. Quantitative angiography packages that automate this reconstruct from two calibrated views by matching vessel points across the images, and that matching is exactly where overlap and foreshortening cause trouble.
A group at A*STAR, Nanyang Technological University, and the National Heart Centre Singapore (Yu Ren, Hwee Kuan Lee, Tat-Jen Cham, Jonathan Yap, and Khung Keong Yeo) posted arXiv:2610.09383 on 7 October 2026. Their network, PPCAR-Net, skips point matching altogether. It takes between one and seven segmented angiographic views plus the gantry angle of each, and returns a connected 3D coronary tree with a radius along every branch. The code and trained checkpoints are on GitHub under an MIT license.
What goes in and what comes out
The input is not a raw angiogram. It is a binary vessel mask for each view, which means you need a coronary segmentation step upstream, together with the primary and secondary angle of each view (RAO or LAO, CRA or CAU). The method has one model for the right coronary artery and one for the left, so you also tell it which tree you are reconstructing.
The output is what the authors call a vessel code. For every branch it holds an existence flag, 20 B-spline control points that define a smooth 3D centreline, and 200 radius values in millimetres along that centreline. The right artery gets up to 7 branches and the left up to 13. Because each branch is a spline and each side branch is trained to start on its parent, the result comes out as a connected tree you can edit, measure, or render as tubes. Nothing has to be skeletonised out of a volume afterwards.
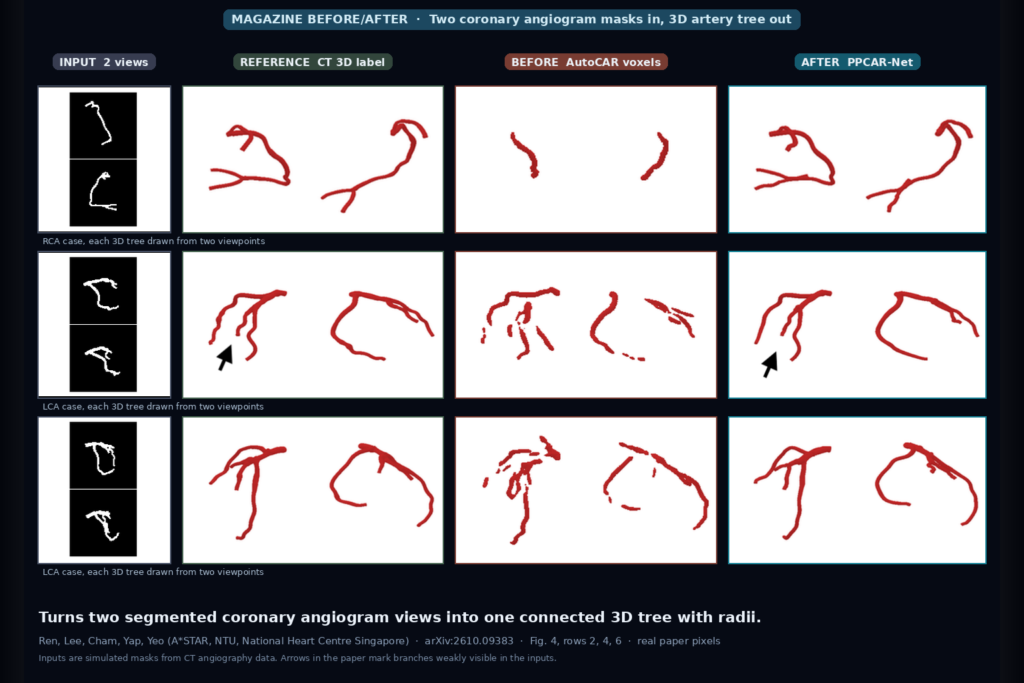
The featured image is Fig. 4 of the paper. Each row is a case rendered from two viewpoints. From the left: the pair of input masks, the 3D label taken from CT, the output of AutoCAR (an earlier method that predicts a voxel volume), and the output of PPCAR-Net. The voxel output breaks into separate pieces. The PPCAR-Net output stays in one piece, and the arrows in the paper mark branches that are poorly visible in the inputs and that the model still draws.
How it works
The first stage is a coarse guess. Each mask goes through a frozen VGGT-1B backbone, a general-purpose multi-view vision transformer, and the gantry angles of each view are encoded and appended to the image tokens. A set of learned branch queries then looks across all views, one query per possible branch, and predicts that branch’s existence, its control points, and its radii. This stage mostly learns what coronary trees tend to look like, so it can produce a plausible tree when the views are ambiguous.
The second stage checks the guess against the images. The coarse tree is projected back into every input view using the same cone-beam geometry that made the inputs. The network samples the mask around each projected point and predicts a small correction to each control point. That runs for four rounds. A second refiner then does the same for the radii in three rounds, with the centreline frozen. There is no per-case optimisation, only forward passes.
Two training choices matter most. The first is the B-spline parameterisation. In the paper’s two-view ablation, predicting and refining 200 dense centreline points directly reached a refined right-artery Dice of 22.18, against 66.92 for 20 control points per branch, and the spline reproduces the ground-truth centrelines to a mean error of 0.164 mm. The second is branch-subset augmentation: each training tree is also shown with its side branches removed one by one, so the model learns that side branches are optional. Existence accuracy went from 92.95% to 94.63%, with fewer false side branches.
Data and training
There are no paired real angiograms and 3D labels at scale, so the authors build their own pairs from the public ImageCAS coronary CT angiography dataset. They split each case into right and left trees, skeletonise, check the graphs by hand, and keep 750 right and 750 left trees, each with 600 training, 75 validation, and 75 test cases. For every tree they render seven synthetic 256 by 256 projection masks at clinically typical angle pairs with a cone-beam model, with the angles jittered by up to 10 degrees.
Training uses one GPU per run, AdamW, and at most 200 epochs for the coarse and geometry stages and 100 for the radius stage. The VGGT features are precomputed. The paper does not report total training time.
What the numbers say
The comparison methods are 3DGR-CAR (Gaussian primitives), AutoCAR, and DeepCA (both voxel outputs). The authors retrained all of them on their own split and views, and reimplemented the pieces of 3DGR-CAR and AutoCAR whose code was incomplete, so these are not the numbers from those papers.
The voxel methods win or tie on pure overlap with two views. On the right artery, AutoCAR scores a Dice of 68.76 and PPCAR-Net 66.92. On the left artery, DeepCA leads with 56.56 against 49.45. Where PPCAR-Net separates is structure. Its centreline agreement is the best on the right artery with two views, and the number of disconnected pieces in its output is about 1.05 on average, against 3.35 for AutoCAR and 4.41 for DeepCA on the right artery, and 11.36 and 9.97 on the left. 3DGR-CAR is the extreme case: 159.62 pieces on average for two right-artery views. For a viewer that needs one tree to measure along and to colour by radius, I care more about that count than about a Dice point.
With four views the right-artery Dice reaches 73.05 and the centreline distance falls to 2.12 mm. With one view the model gives a tree-shaped guess (Dice 27.37 on the right artery, 19.73 on the left) that the paper calls an artery-shaped hypothesis, not a measurement.
Replacing the learned refiner with direct per-case optimisation from the same coarse start gave 41.02 Dice on the right artery against 66.92 for the learned refiners, and it took 11 seconds rather than 61 milliseconds.
Speed
On one RTX 4090 with two views, the refined model takes 121 ms from input masks to finished vessel code, and 60 ms for the coarse stage alone. The authors time the others on the same GPU, including the graph-extraction step they need: AutoCAR 3.76 s, DeepCA 2.69 s, and 3DGR-CAR 63.7 s. SDF-CAR, which fits a model per patient, is reported at about 45 minutes. At 121 ms I would try several frame pairs from the same run and keep the one that fits the images best.
Real angiograms and narrowing
Fig. 5B runs the model on a real two-view X-ray angiography case from the AutoCAR dataset. The overlay sits on the actual angiogram and the 3D tree is coloured by radius. It looks sensible, but there is no 3D label for that case, so the paper states that nothing about accuracy can be said from it, and that it is not systematic clinical validation.
Fig. 5A uses a diseased case from the ASOCA CT dataset with a visible narrowing. The coarse prediction gets the global shape and the refinement recovers the radius reduction from the 2D evidence. The authors are careful about this: it shows sensitivity to a narrowing that is visible in the masks, not stenosis detection, and the model cannot reliably find a narrowing that overlap or foreshortening hides in every view you give it.
Where it falls short
Every number in the paper comes from simulated masks. They are clean, derived from CT labels, and perfectly calibrated. Real inputs bring segmentation errors, calibration drift, and a heart that moved between the two sequential shots even after phase matching. The authors say this directly and list motion-aware reconstruction as future work. Components with unreliable labels were also dropped by hand, which the authors note may bias the cohorts towards cases with clearer annotations, and right and left trees can come from the same patient because they are separate components of the same case.
The model is supervised, so it needs 3D vessel labels, and its anatomical prior comes from the training set. The geometry assumes a fixed projection set-up (a 0.75 m source to isocentre distance and a 0.90 m source to detector distance in the data) and I did not see anything in the paper showing how it behaves when a real system departs from that. There is also no comparison with a clinical 3D quantitative angiography package.
Code, weights, and data
The repository is github.com/G2304138H/PPCAR-Net, licensed MIT, with a project page. It includes the model, the refiners, the RCA and LCA checkpoints in the repo, and two examples, one per artery, each with seven projection masks, camera directions, and reference annotations. You run python -m vessel_code.evaluate with a config file, choose one to seven views, and get prediction files, projection overlays, and 3D figures. The first run downloads facebook/VGGT-1B, which keeps its own license. I did not run it. The README documents inputs as prepared projections or an annotated CT volume, and I did not find a documented route from a raw DICOM angiogram. The training data is ImageCAS, under its own terms.
How we would wire it into a viewer
The reconstruction would sit beside the angiogram as a derived object, never as the image a cardiologist reads. In a DICOM viewer, the pipeline picks two or more phase-matched frames from XA series, runs a coronary segmentation model on each, reads the positioner primary and secondary angles from the DICOM header, converts them to the paper’s sign convention (LAO and CRA positive, RAO and CAU negative), and calls the model. The result appears as a rotatable 3D tube model coloured by radius and linked to the source frames, and the same tree is projected back onto each view so the user can judge the fit.
I would mark it as a model estimate in the UI and the series description, keep it out of any measurement that goes into a report, and let the user edit control points, which the vessel code makes possible. Before it goes near a clinic, I would test it on our own studies. That means checking the angle sign conventions, how the gantry geometry differs from the fixed set-up in the paper, and how it handles segmentation misses and cardiac motion between two shots.
Sources
- Ren, Y., Lee, H. K., Cham, T.-J., Yap, J., Yeo, K. K. PPCAR-Net: Projection-Refined Parametric 3D Coronary Artery Reconstruction from Sparse X-ray Angiographic Views. arXiv:2610.09383, 2026. https://arxiv.org/abs/2610.09383. PDF: https://arxiv.org/pdf/2610.09383.
- Code, checkpoints, and project page: https://github.com/G2304138H/PPCAR-Net.
- Zeng, A., et al. ImageCAS: A large-scale dataset and benchmark for coronary artery segmentation based on computed tomography angiography images. Computerized Medical Imaging and Graphics, 109:102287, 2023. https://doi.org/10.1016/j.compmedimag.2023.102287.
- Zhu, Y., et al. Sparse and transferable three-dimensional dynamic vascular reconstruction for instantaneous diagnosis. Nature Machine Intelligence, 7:730 to 742, 2025. https://doi.org/10.1038/s42256-025-01025-7.
- Featured image: Fig. 4 of arXiv:2610.09383, rows 2, 4, and 6. Input masks, CT label, AutoCAR output, and PPCAR-Net output as published.