
A cine cardiac MRI is a short movie of one heartbeat, and a viewer needs the whole movie to show wall motion or to measure ejection fraction. Getting it normally takes ECG gating and repeated breath-holds. When a study arrives with a single surviving frame, or from a cohort scanned without gating, there is no movie to play. A team at Johns Hopkins University and Massachusetts General Hospital and Harvard Medical School (Shiyi Wang, Ruochen Sun, Xiang Li, Peirong Liu, and Fangxu Xing) posted arXiv:2610.09397 on 7 October 2026 with PhaseFlow, a model that takes one end-diastolic (ED) frame and generates a 30-frame heartbeat without any ECG signal. The movie is generated, and the paper itself says its ejection fraction error is above the clinical threshold.
What goes in and what comes out
The input is one ED frame of a 2D cine slice, plus a label saying which of five ACDC groups the patient belongs to: normal, dilated cardiomyopathy (DCM), hypertrophic cardiomyopathy (HCM), prior myocardial infarction (MINF), or abnormal right ventricle (ARV). The output is 30 frames spanning the cardiac cycle for that slice. The label can come from clinical metadata or, the authors say, from a simple classifier.
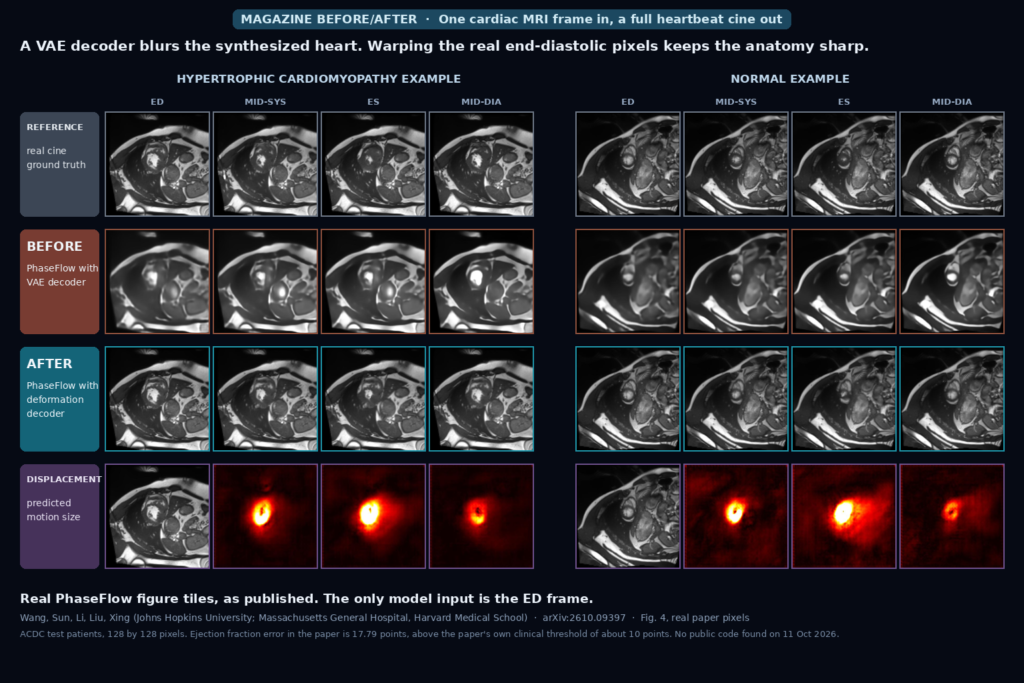
The featured image is built from Fig. 4 of the paper, with every tile taken as published and only cropped and resized. The top row is the real cine, for reference. The second row is PhaseFlow with a standard VAE decoder, and the third row is PhaseFlow with its deformation decoder. The bottom row shows how large the predicted motion is at each frame. An HCM patient and a normal patient are shown, at ED, mid-systole, end-systole (ES) and mid-diastole.
How it works
The model does not paint new pixels. It predicts how to move the ED pixels. A latent rectified flow model, a kind of flow matching network that can generate in a single step, starts from a latent code of the static ED frame and predicts a velocity toward the latent code of the full sequence. A small transposed-convolution decoder then turns that latent velocity into a displacement field for each frame, integrated by scaling and squaring so the warp cannot fold over itself. Each output frame is the real ED image warped by its field with bilinear sampling. The authors checked the fold-free claim on the test slices and found 0.00 percent of pixels with a non-positive Jacobian determinant.
Timing comes from a phase signal. In training, a frozen segmentation network measures the left-ventricle (LV) area on every real frame, and the phase of each frame is the cumulative absolute change of that area, scaled to run from 0 to 2 pi. Systole is fast and diastole is slow, so this spaces frames by how much the heart moves, and end-systole lands near pi across patients instead of drifting with heart rate. At inference there is no sequence to measure, so the model uses the mean phase curve of the patient’s pathology group from the training set.
Training adds a loss on the LV area curve itself, applied only to real frames: the ED mask is warped by the predicted displacement and its area is compared with the area on the real frame at each time point, normalised by the ED value. Without that term the pictures stay good but the contraction goes wrong.
What the numbers say
All tests are on ACDC, a benchmark of 150 subjects with 30 per pathology group, split into 105 training, 15 validation and 30 test patients. Images are 128 by 128. Training took about 5.5 hours on one RTX A6000. Against five baselines retrained on the same split in Table 1, PhaseFlow has the best SSIM (0.956), the best FID (12.72) and the only positive volume curve R squared (0.363), which means its predicted LV area curve is the only one that fits the true curve better than a flat average. The ejection fraction error is 17.79 percentage points. A model that repeats the ED frame scores 51.37, direct registration 19.66, and a video diffusion baseline adapted from echocardiography has the lowest of all at 15.47 but with a SSIM of 0.219, which the authors read as blurry frames that happen to reach the right ED and ES sizes.
In the Table 2 ablation, swapping the deformation decoder for a VAE decoder drops PSNR from 31.72 to 27.28 dB and raises FID from 12.72 to 89.63, which is the blur you can see in the featured image. Using a uniform phase instead of the nonlinear one raises ejection fraction error from 17.79 to 21.30, and removing the volume loss raises it to 26.80. Without the local cross-correlation image loss, the images collapse to PSNR 15.17.
The model was also run on the M&Ms dataset without retraining, 136 patients and 1,621 slices from four scanner vendors, with the ACDC templates. Image quality held up and the ejection fraction error was 19.89 percent, with a volume curve R squared of 0.309.
What the pictures show
In the featured image the VAE decoder frames are soft. The structures around the heart lose their edges and the bright blood pool turns into a smooth blob, while the deformation decoder frames keep the outlines of the real cine. The displacement row shows the predicted motion concentrated around the left ventricle, and it looks strongest at end-systole in both examples. The paper’s extended figure shows one patient from each of the five groups, selected by hand to illustrate each pathology, so I would not read it as a typical case.
Where it falls short
The authors call the ejection fraction error of 17.79 percent above the clinical diagnostic threshold of about 10 percent and say larger cohorts are needed before clinical use. The per-patient spread is large: ejection fraction error is 17.79 with a standard deviation of 11.15, and the volume curve R squared is 0.363 with a standard deviation of 0.489. All numbers come from a single training run with one fixed seed, on 30 test patients. The physiology metrics come from warping the real ED mask through the predicted field, not from segmenting the generated frames. The model also needs a pathology label and a group template at inference, so a wrong label means a wrong heartbeat. The paper says low image quality or heavy motion artifacts may degrade the phase signal. It tests ACDC and M&Ms only, lists echocardiography and lung MRI as future work, and reports no clinician review. Because the timing comes from a group average, I would not expect it to reflect one patient’s own heart rate or rhythm.
Code, weights, and data
I found no code or weights. The paper does not give a repository link, and on 11 October 2026 GitHub repository searches for PhaseFlow with cardiac or cine terms, and for the paper title, returned nothing. The Hugging Face model called PhaseFlow is a protein model and unrelated. The data are ACDC and M&Ms, both public challenge datasets. The paper builds its VAE on the architecture from ECGFlowCMR (Fang et al. 2026). The segmentation network is a standard 2D UNet trained on ACDC.
How we would wire it into a viewer
We would not store a generated cine as if the scanner acquired it. We would label the series as synthesized, put the model name, version and the pathology label used into the DICOM description, hide ejection fraction and volume tools on it, and play it only as a visual aid next to the real ED frame. The authors also suggest data augmentation for segmentation and disease classification, where a wrong ejection fraction costs less than it would in a clinic.
Before trying it on our own studies we would test four things: how often the pathology template is wrong for a real patient, how it behaves on slice positions and vendors the authors did not use, whether the displacement invents motion the true cine does not have, and whether readers can tell real from synthesized cine in a blind check. For related heart work on this site, see our post on cardiac MRI reconstruction with frozen foundation encoders.
Sources
- Wang, S., Sun, R., Li, X., Liu, P., Xing, F. One Frame, Full Heartbeat: ECG-Free Cardiac Cine MRI Synthesis via Phase-Conditioned Flow Matching. arXiv:2610.09397, 2026. https://arxiv.org/abs/2610.09397. PDF: https://arxiv.org/pdf/2610.09397.
- Bernard, O., et al. Deep Learning Techniques for Automatic MRI Cardiac Multi-Structures Segmentation and Diagnosis: Is the Problem Solved? IEEE Transactions on Medical Imaging 37(11), 2018 (the ACDC dataset).
- Campello, V. M., et al. Multi-Centre, Multi-Vendor and Multi-Disease Cardiac Segmentation: The M&Ms Challenge. IEEE Transactions on Medical Imaging, 2021.
- Featured image: Fig. 4 of arXiv:2610.09397, HCM and normal example patients as published.