
CT reconstruction has two meanings that people mix up. First: turning raw projection data (the sinogram) into axial slices. That is filtered back projection or iterative reconstruction. Second: turning those slices into something you can spin on a screen, a surface mesh or a volume render.
This page covers both, plus a short history of how we got from paper tape to a model you can rotate in a viewer. If you already have a DICOM series and want a printable mesh, skip to CT scan to 3D model. MRI is a different physics problem: 3D MRI reconstruction.
From paper tape to a volume you can rotate
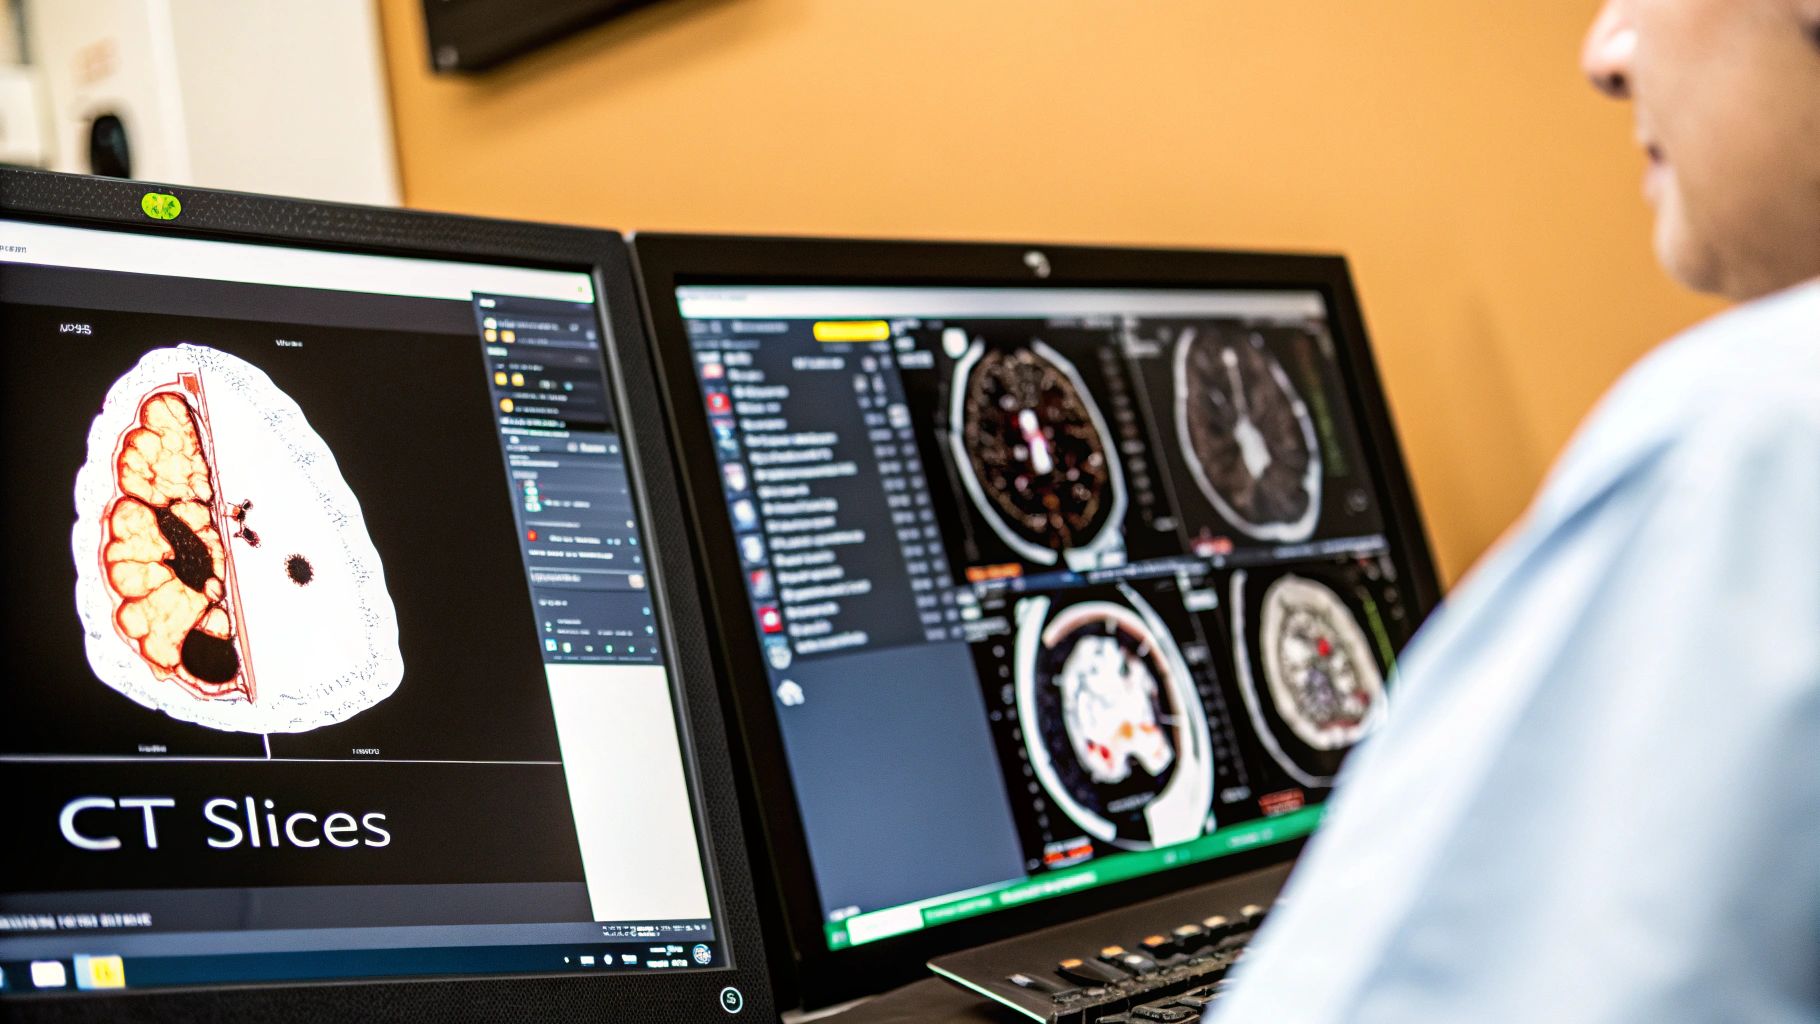
The first live-patient CT image was 1971. The project budget was about £69,000 over three years. A scan could take nine days to acquire; the computer then needed about 2.5 hours for one image. Early matrices were 32×32, later 80×80. One of those frames lived on a paper tape about 90 meters long. Technicians read an oscilloscope and sometimes shot a Polaroid of the screen, with exposures up to an hour. Changing window/level meant rewinding the tape and recomputing. Those numbers are from a historical review on PMC.
Scan times later dropped from days to seconds. That is why 3D became a clinical tool instead of a lab demo: you finally had hundreds of thin, registered slices from one breath-hold.
FBP and iterative reconstruction
Before anyone talks about “3D models,” the scanner has to turn projections into slices.
- Filtered back projection (FBP). Each projection is high-pass filtered (classically a Ram-Lak kernel), then smeared back across the image grid. Fast, deterministic, and still the teaching default. At low dose it is noisy. Metal and sparse views streak.
- Iterative reconstruction (IR). Start with a guess, forward-project it, compare to the measured sinogram, update. Statistical IR models noise. Model-based IR also models the system (focal spot, detector response). You can drop dose or clean streaks; you pay in compute, and over-smoothed IR can look plastic.
Photon-counting CT changes the detector, not the idea: instead of integrating all photon energy into one bucket, the detector counts photons and bins their energies. That gives higher spatial resolution, better material separation (e.g. soft vs calcified plaque), and often a lower dose for the same noise. Reconstruction is still FBP or IR on those counts.
3D visualization does not add a second radiation hit. It is software on the same DICOM volume. A thick-slice “survey” CT, though, will not make a useful model. You want thin slices and little or no gap.
From slices to a model you can spin
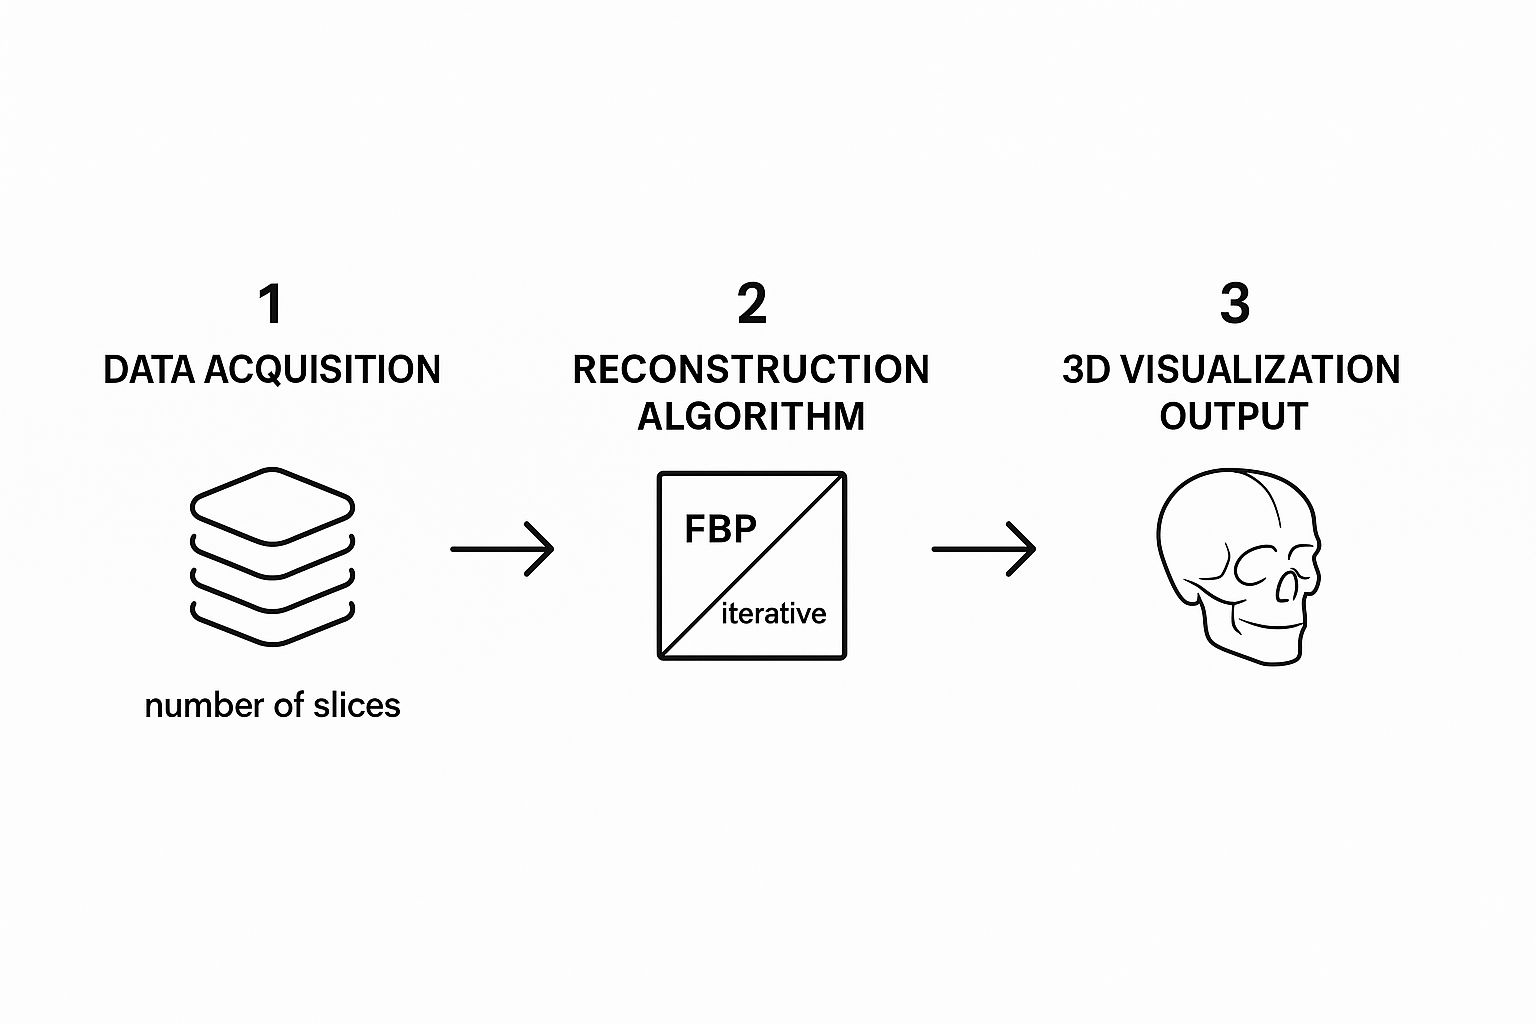
Three stages after the volume exists:
- Acquisition quality. Slice thickness and spacing set the ceiling. Thin, overlapping or contiguous slices sculpt; thick slices brick.
- Segmentation. Mark which voxels are bone, vessel, liver, tumor. Density helps (bone is bright, air is black, soft tissue is gray), but thresholding alone fails at thin cortex, contrast boundaries, and metal. This is the slow step when a person traces slice by slice.
- Rendering. Either build a surface, or assign color and opacity to every voxel.
| Technique | How it works | Use it when |
|---|---|---|
| Surface rendering | Extracts the outer boundary of a segmented structure and builds a shell (usually triangles) | Shape of a bone, fracture fragments, organ exterior, anything you might print |
| Volume rendering | Maps every voxel to color and transparency; you look through the volume | A tumor inside a liver, vessels through parenchyma, anything where inside-and-around matters |
Surface is a solid object. Volume is a see-through block. Most surgical planning stations do both: volume for the overview, surface when they need a measurement or an STL.
What people actually do with it
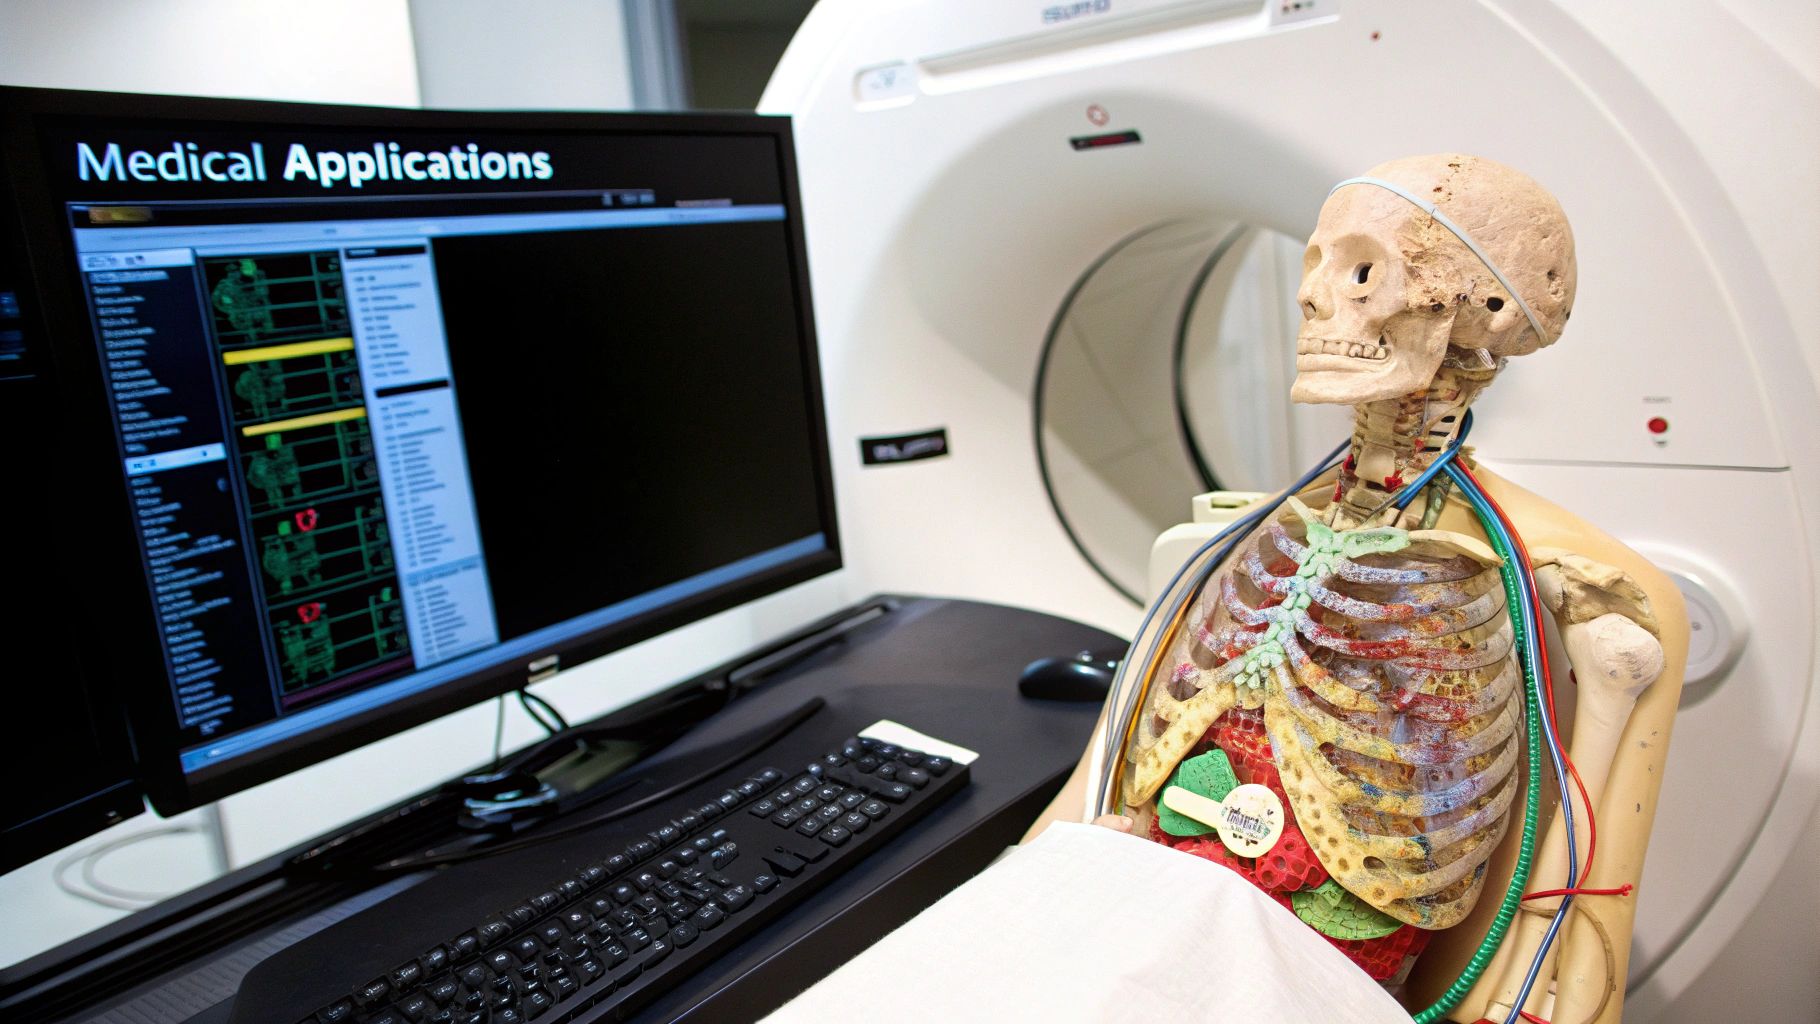
- Oncology. Tumor vs vessels vs remnant organ volume (liver resection is the usual example). The point is spatial relationship, not a prettier picture.
- Ortho / craniofacial. Shatter fractures, custom cranial plates, jaw reconstruction, implant size and trajectory. Surface meshes become surgical guides and implants.
- Interventional radiology. A 3D vessel map for catheter path, aneurysm neck, or a blockage.
Who builds it: a CT technologist or a radiologist with 3D software, sometimes a biomedical engineer if the output is a device. The clinician who operates on the patient is rarely the one clicking thresholds.
AI in this pipeline
The bottleneck is segmentation, not the FFT. A network trained on labeled CTs can outline organs, bone, and some tumors in minutes. That is consistency and speed, not a substitute for a check by someone who knows the anatomy. Same models can flag density or texture outliers for a second look.
4D CT adds time: several volumes in sequence, a beating heart or a breathing lung. Useful for function. Still the same reconstruction and render steps, repeated.
PYCAD builds custom web DICOM viewers (MPR, volume rendering, segmentation) when the 3D view has to live inside a hospital or medtech workflow. Case studies.