
Every CT team that ships a denoiser, a new reconstruction kernel, or a lower-dose protocol gets the same question from someone: did image quality go down? The honest answer usually needs a phantom, a reader study, or a reference scan of the same patient, and none of those exists for a series that came off the scanner an hour ago. So people reach for a no-reference score. NIQE, a metric built for photographs, has been used to rank CT denoisers and served as a baseline in the LDCTIQAC 2023 CT quality challenge.
A new preprint by Fabio Mattiussi, arXiv:2610.00384, posted on 30 September 2026, refits NIQE on public full-dose CT, releases the model with everything needed to rebuild it, and tests the score on the two decisions a team would use it for. It passes one and fails the other. The model is called RIQE, for Radiology Image Quality Evaluator. Code is MIT, the model file is CC BY 4.0.
For anyone running a CT pipeline, RIQE is a reasonable alarm for “this image got noisier or blurrier than its source”. It is a bad judge of which denoiser to pick, because at the strengths tested it prefers the filter that wipes out most of a small low-contrast lesion.
What goes in and what comes out
The input is one axial CT slice in Hounsfield units, read straight from DICOM. The released reader applies RescaleSlope and RescaleIntercept and picks up the vendor’s PixelPaddingValue so that the area outside the reconstructed field of view can be masked. The output is one number per slice, and lower means closer to the full-dose reference. If the slice has too little body in view to give at least 72 valid patches, the code returns NaN.
The README is blunt about it. The number is a distance from a declared reference model, and it does not measure diagnostic quality. The model does not know what a lesion is, and RIQE values cannot be compared with NIQE values reported elsewhere.
How it works
NIQE, published by Mittal, Soundararajan, and Bovik in 2013, cuts an image into patches, normalises each pixel by its local mean and contrast, and fits simple distributions to those values and to products of neighbouring values, at two scales. That gives 36 numbers per patch. A pristine corpus defines a reference: the mean and covariance of those 36 features over many clean patches. A test image gets its own mean and covariance, and the score is a Mahalanobis-style distance between the two. The original reference was fitted on 125 natural photographs.
The paper shows where the photographic settings break on CT. The original 96 x 96 pixel patches leave about 10 patches inside the body of a 512 x 512 slice, too few to estimate a covariance. NIQE’s patch selection keeps only patches whose local activity exceeds a fraction of the image maximum, and in CT the most active patch is a bone-air edge, so at the nominal setting only 2 to 6 patches per slice survive. The normalisation constant, calibrated on 8-bit photographs, lets absolute noise amplitude leak into the features on CT soft tissue.
RIQE fixes these choices and declares them. Hounsfield units are clipped to the range -1000 to +1000 and mapped linearly to 0 to 255 in floating point, with no rounding, and that mapping is part of the model. Patches are 24 x 24 pixels, the stabilising constant is 0.01, and when fitting, only patches whose activity exceeds half of the image maximum go into the reference. A patch counts only if it sits entirely inside the field of view and at least 90% inside a body mask. The field-of-view rule handles a vendor quirk. GE images in this collection pad 21.3% of every slice with -3024 HU outside the field of view and Siemens images pad none, so without the mask the score would measure a DICOM padding convention and call it a vendor difference.
Data and fitting
Everything comes from the TCIA collection LDCT-and-Projection-data, version 7, Chest and Liver/Abdomen subsets, released under CC BY 4.0. The full-dose series fall into five protocol cells across Siemens and GE, with chest at 1.25 to 1.5 mm and abdomen at 5 mm. Head CT is under controlled access and was not used.
After declared exclusion rules (ends of each series, slices with too little or too much body in view, metal), the author kept 24 evenly spaced slices per patient. Patients were split once, before any fitting: 158 to fit the model and 40 held out for testing. The released model, fitted on 121,213 patches from 3,792 full-dose slices, is a 36-value mean and a 36 x 36 covariance matrix, and its JSON lists every slice used with UIDs and SHA-256.
For the 100 Siemens patients the collection also has a reduced-dose version of each scan, 10% of routine dose for chest and 25% for abdomen. The data providers made these by inserting noise into the full-dose projection data and reconstructing with the same settings, so they are simulated rather than acquired at lower dose.
What the numbers say
On the 40 held-out patients, the ranking test goes well. A simulated reduced-dose slice scores worse than the full-dose slice at the same table position in all 240 chest pairs and in 230 of 240 abdominal pairs (95.8%). Noise added at 20% or more above the slice’s native level is caught in 97.5 to 100% of images, and Gaussian blur of one pixel or more in 99 to 100%. Half-pixel blur on the thin, sharp-kernel chest slices is caught only about half the time.
The photographic baseline gives the contrast. The same code fitted on 119 public-domain and CC0 photographs with the parameters published for NIQE ranks every simulated reduced-dose abdominal image as better than its full-dose counterpart. That is a refit with NIQE’s settings, and the original NIQE model was not tested, but anyone scoring CT against a photographic reference should check which way their numbers point.
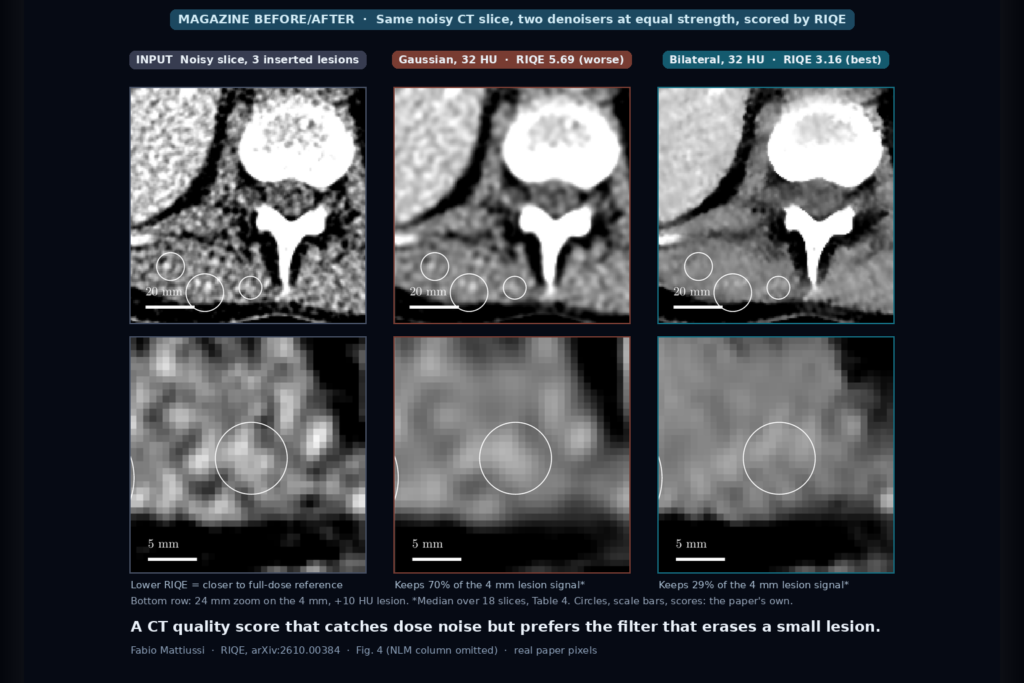
The selection test is where it falls over, and the featured image shows it on one real held-out slice. The author added noise at the level that separates full-dose from simulated quarter-dose abdomen, inserted soft discs of 4, 6 and 10 mm at +10, +15 and +25 HU, and ran five classical denoisers, each tuned to change the image by the same amount (a residual of 2 to 64 HU). For each filtered image he checked whether RIQE scored it better than the unfiltered one, and how much of the lesion survived.
On the 18 abdominal slices with room for a 4 mm, +10 HU lesion, RIQE preferred the bilateral filter in every image up to a 32 HU residual. At that strength 29% of the lesion’s matched-filter signal remains and its detectability index drops from 0.51 to 0.33. Gaussian smoothing at the same strength keeps 70% of the signal and a detectability index of 0.48, and RIQE never preferred it to the unfiltered image. In the featured slice, scored without the lesions as in the experiment, the bilateral version gets 3.16, better than the noisy input at 3.88, and the Gaussian version gets 5.69. The circle in the bottom-right tile is where the 4 mm lesion should be.
The paper’s hypothesis is that the reference is built from the most active patches, which are mostly edges. An edge-preserving filter keeps the edges and flattens the low-contrast texture where noise and small lesions both live, which moves the features towards the reference, while linear smoothing softens the edges too and gets penalised. Averaging over all filters hides the problem, since the median score across filters worsens steadily with strength.
Against radiologists, the evidence is thin and labelled as exploratory. On the 1,000 LDCTIQAC 2023 training images, which come from about 100 slices of seven patients, the rank correlation with the mean score of five radiologists is -0.24 pooled and -0.47 within groups of images derived from the same source slice (negative is the expected direction).
Where it falls short
The author lists most of these himself. There is no reader study and no claim about diagnostic performance. The reduced-dose images are simulated and exist for one vendor only, with 10 test patients per region. The corpus is one collection with two vendors and two body regions, and kernel, slice thickness and anatomy are not crossed, so a chest-versus-abdomen difference cannot be pulled apart from a kernel difference. Motion and streak artefacts are not detected directly. Only five classical filters were tested, and deep-learning denoisers, which are what most teams would want to evaluate, were not. The lesions are synthetic discs, mostly in muscle, scored by a model observer that is not calibrated to human readers.
The single model is a deliberate simplification with a cost. Sub-models fitted on different kernels or anatomies diverge from each other by 0.5 to 2.7 times as much as a simulated dose reduction on the same patients, so absolute scores across protocols do not mean much. The hyperparameter criterion was also revised once, after looking at validation data and before touching the test set. The paper reports both, and the original choice ranks reduced-dose abdomen correctly in only 28.5% of test pairs. That disclosure is a large part of why I trust the rest of the numbers.
Code, model, and license
The repository is github.com/Metallogik/RIQE, with the release archived on Zenodo (doi:10.5281/zenodo.23055559). Code is MIT, and the model file and manifests are CC BY 4.0, so any use must also cite the TCIA collection and acknowledge its NIBIB grants. Dependencies are permissive (NumPy, SciPy, pydicom, scikit-image and a few others), and the author left out pyiqa and BM3D because of their licences. Scoring a slice takes a few lines of Python. Rebuilding the model needs the 36 GB corpus from TCIA (about 3.5 hours to download, no registration), and a verification script refits it bit-identically in the recorded environment. The paper does not report scoring time.
How we would wire it into a viewer
I would keep RIQE numbers away from the reading screen. A radiologist has no way to interpret a distance from a 36-dimensional reference, and the score says nothing about whether a finding is still visible.
It belongs on the QA side of the platform. When a series arrives, a background worker can score a handful of central slices and store the result with the DICOM attributes that define the protocol: Manufacturer, ConvolutionKernel, SliceThickness, BodyPartExamined, and PixelSpacing. Scores are compared only inside one protocol group, and only in pairs of the same anatomy: the original reconstruction against a denoised derived series, or a reconstruction with and without a vendor’s noise-reduction option on the same raw data. A jump in the paired score sends the series to a physicist for a look and blocks nothing.
What I would not do is let RIQE choose the denoiser strength or rank denoising models, which is where a vendor or an internal team will be tempted to use it. For that decision you still need task-based evaluation, with real or inserted lesions and readers or a calibrated model observer. And since deep-learning denoisers were not tested, I would run the lesion experiment from the repository on any network we planned to ship before trusting RIQE around it at all.
Sources
- Mattiussi, F. RIQE: a NIQE-style reference model for Computed Tomography. arXiv:2610.00384, 2026. https://arxiv.org/abs/2610.00384. PDF: https://arxiv.org/pdf/2610.00384.
- Code and model: https://github.com/Metallogik/RIQE. Zenodo release v1.0: https://doi.org/10.5281/zenodo.23055559.
- Mittal, A., Soundararajan, R., Bovik, A. C. Making a “completely blind” image quality analyzer. IEEE Signal Processing Letters 20(3), 2013. https://doi.org/10.1109/LSP.2012.2227726.
- McCollough, C., et al. Low Dose CT Image and Projection Data (LDCT-and-Projection-data), version 7. The Cancer Imaging Archive, 2020. https://doi.org/10.7937/9npb-2637.
- Moen, T. R., et al. Low-dose CT image and projection dataset. Medical Physics 48(2), 2021. https://doi.org/10.1002/mp.14594.
- Lee, W., et al. Low-dose computed tomography perceptual image quality assessment. Medical Image Analysis 99, 2025. https://doi.org/10.1016/j.media.2024.103343.
- Featured image: Fig. 4 of arXiv:2610.00384, noisy input, Gaussian and bilateral columns at a 32 HU residual (NLM column omitted). Circles, scale bars and RIQE values are the paper’s.