Clinical trial data analysis is where raw data from a study gets transformed into meaningful proof about a new drug or therapy. It's far more than just running numbers. The real job is to build a rock-solid, evidence-based story that can stand up to the toughest regulatory questions and, ultimately, make a difference in patients' lives. In today's research environment, this discipline has become more critical—and more complex—than ever.
Why Clinical Trial Data Analysis Matters Now More Than Ever

We're in a new era of clinical research, and data is the most valuable currency we have. The days of simple spreadsheets and basic statistical tests are long gone. If traditional analysis was like using a paper map to find your way, modern analysis is like having a real-time GPS with predictive traffic analytics—it guides researchers through a landscape that's growing more intricate by the day.
The fundamental goal hasn’t changed: turn mountains of raw data points into clear, reliable conclusions. What has changed is the sheer scale and complexity of that data, pushed forward by a few powerful forces.
The Forces Driving Change
The modern clinical trial is a perfect storm of massive data volumes and sophisticated science. Several key factors are behind this shift:
- The Data Deluge: Think about it. Wearables, electronic health records (EHRs), and decentralized trials are pumping out continuous streams of real-world data, adding incredible depth but also layers of complexity.
- Intricate Therapies: Fields like oncology and rare diseases are all about personalized medicine, biologics, and gene therapies. These aren't one-size-fits-all treatments, so they demand much more nuanced analysis to prove they work for specific patient groups.
- Globalized Research: Trials often span multiple countries, which means you're dealing with diverse datasets that have to be carefully standardized and harmonized before any real analysis can even start.
This evolution is mirrored in the industry's explosive growth. The global clinical trials market was valued at $483 billion in 2023 and is on track to hit $887 billion by 2032, driven by the constant need for new therapies and the adoption of smarter digital tools. If you're curious about how technology is influencing the broader medical field, which directly affects trial methodologies, you can explore various AI solutions for the healthcare industry.
The ultimate goal of clinical trial data analysis is to establish causality—to prove with a high degree of certainty that the observed patient outcomes were caused by the treatment and not by random chance or other confounding factors.
Consider this guide your roadmap for navigating this high-stakes world. We'll break down the essential statistical methods, map out the modern data workflow, look at how AI is changing the game, and cover the best practices you need to deliver results with confidence and clarity.
Understanding Core Statistical Methods
At the end of the day, clinical trial data analysis boils down to one simple question: did the treatment actually work, or were the results just a fluke? Statistical methods are the disciplined, mathematical tools we use to answer that question with confidence, separating a real treatment effect from random background noise.
Think of it like a detective investigating a case. You have clues—the data—but you can't just say, "it looks like this person did it." You need a rigorous process to build a case that holds up to scrutiny. That’s exactly what statistical testing does for clinical research. It provides the framework to prove your findings beyond a reasonable doubt.
The Foundation: Hypothesis Testing
The whole process is built on a concept called hypothesis testing. It's a structured way of weighing two competing possibilities.
We start by assuming the opposite of what we hope to prove. This is called the "null hypothesis," and it states that the new treatment has zero effect. Any difference we see between the group that got the drug and the group that got the placebo is purely due to random chance. The "alternative hypothesis" is what we're actually testing: that the treatment does have a real, measurable effect.
From there, the entire goal is to see if our data provides enough evidence to confidently throw out the null hypothesis. The famous p-value is central here. It's the probability of getting our observed results (or even more extreme ones) if the treatment was, in fact, useless. A tiny p-value, typically less than 0.05, tells us that our findings were highly unlikely to be a coincidence. This gives us the green light to reject the null hypothesis and conclude the treatment worked.
This infographic breaks down how analysts move from a high-level question to a concrete statistical output.
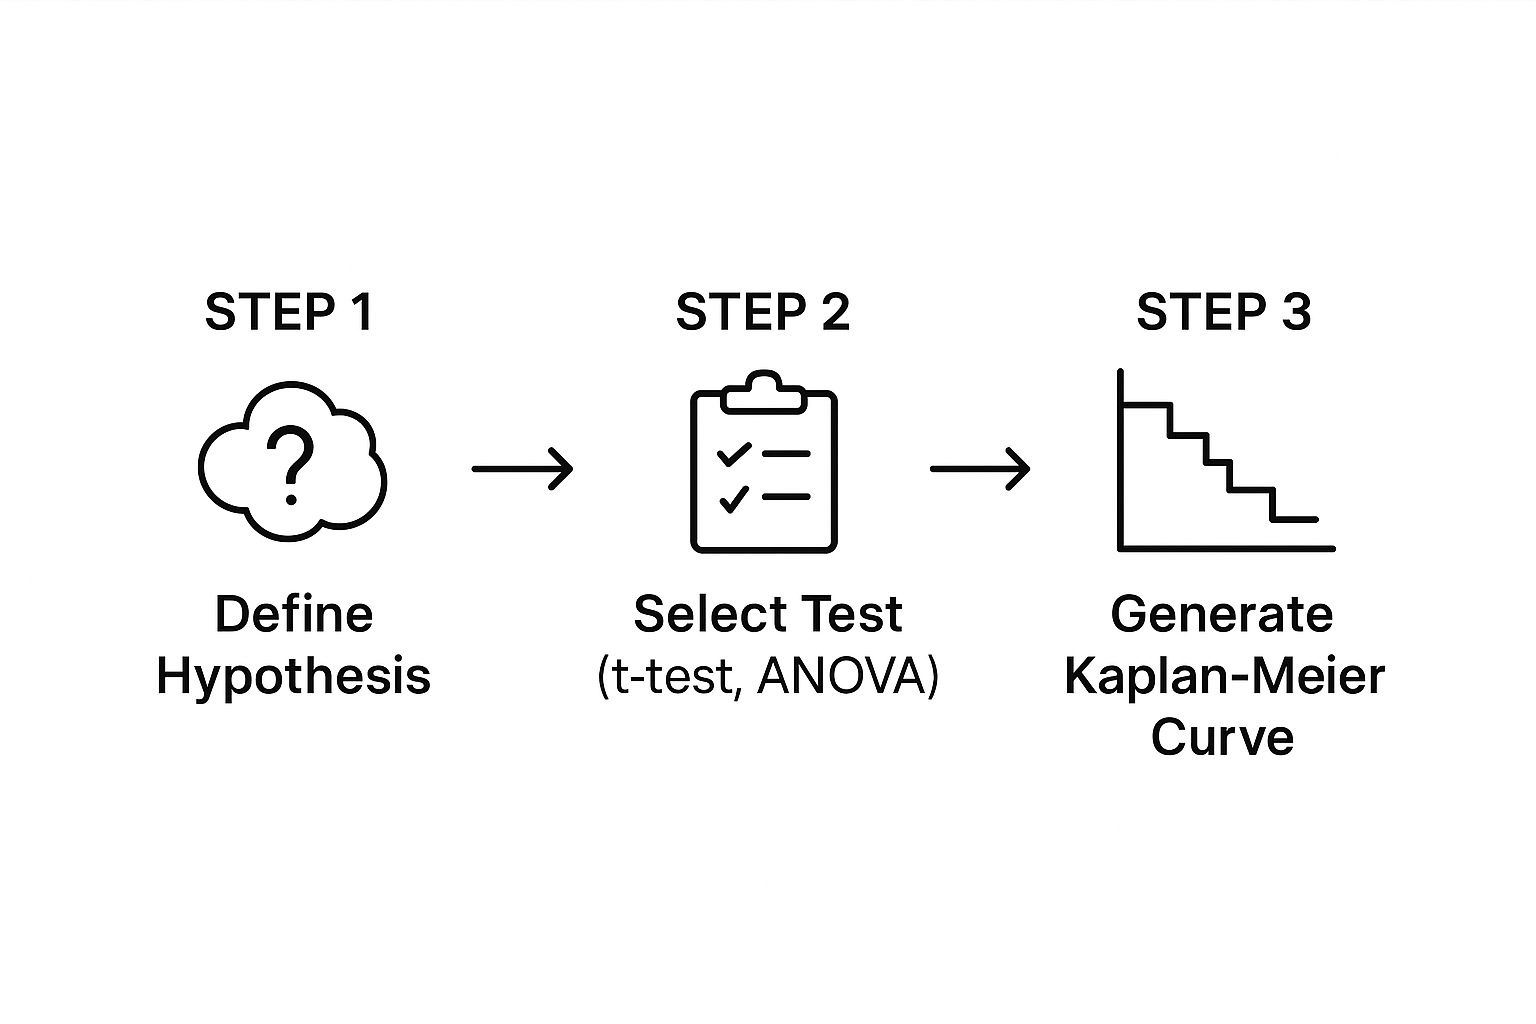
As the visual shows, a clear hypothesis guides the choice of a specific statistical test. The test then crunches the numbers and generates outputs, like the survival curves shown, which help visualize the story the data is telling.
Choosing the Right Analytical Tool
Of course, you can't just use the same tool for every job. The right statistical method depends entirely on the kind of data you've collected and the design of your study. Are you working with continuous numbers like blood pressure readings, or categorical outcomes like "cured" versus "not cured"? Answering that question is the first step.
The table below offers a quick look at some of the most common statistical workhorses and the questions they're designed to answer.
Common Statistical Methods and Their Applications
| Statistical Method | Primary Question It Answers | Example Application |
|---|---|---|
| T-test | Is there a significant difference in the average of a continuous variable between two groups? | Comparing the mean reduction in cholesterol between patients on a new drug and patients on a placebo. |
| ANOVA | Is there a significant difference in the average of a continuous variable among three or more groups? | Testing if a low-dose, high-dose, and placebo group all have different average blood pressure outcomes. |
| Chi-Square Test | Is there a significant association between two categorical variables? | Determining if the proportion of patients who reported side effects is different for the treatment group vs. the control group. |
| Kaplan-Meier Analysis | How does the probability of an event (e.g., survival) change over time for different groups? | Plotting survival curves for cancer patients on an experimental therapy versus those on standard care to see who lives longer. |
Ultimately, the goal is to match the statistical method to the research question and the data type to ensure the conclusions are valid and reliable.
It's crucial to understand that selecting a statistical method isn't something you do after the data is collected. This is a critical decision made during the trial design phase and locked into a document called the Statistical Analysis Plan (SAP). This pre-planning prevents "p-hacking"—the questionable practice of running test after test until you find one that gives you the result you want.
Analyzing Time-to-Event Data
In many fields, especially oncology, the most important question isn't just if something happens (like a tumor recurring), but when it happens. This is where a specialized toolkit called survival analysis is indispensable. These methods are built from the ground up to handle "time-to-event" data.
One of the most powerful and intuitive tools in this kit is the Kaplan-Meier curve. It’s a simple-looking graph that plots the probability of an event—like survival—over time. By putting the curves for the treatment and control groups on the same chart, anyone from a statistician to a clinician can see instantly whether the new therapy is delaying disease progression or extending life in a meaningful way. Those curves tell a powerful story about the treatment's impact.
Mapping the Modern Data Workflow

Getting clinical trial analysis right depends entirely on a well-planned and flawlessly executed workflow. This isn't just about ticking boxes on a checklist. It's a living, breathing system where every single stage is built on the one before it. A good way to think about it is as a "chain of custody" for evidence—if even one link is weak, the entire conclusion can be called into question.
The whole point of this workflow is to take raw observations from all sorts of places and turn them into a clean, standardized dataset that's ready for analysis. Keeping the data's integrity intact and ensuring you can trace every change is absolutely essential. It's what makes the final results scientifically sound and ready for regulatory scrutiny.
The Initial Phase: Data Collection
Everything kicks off with data collection, the ground floor where we gather raw information from trial participants. We've come a long way from stacks of paper forms; modern trials use a whole suite of digital tools to capture high-quality, detailed data.
- Electronic Case Report Forms (eCRFs): These are the digital workhorses of data collection. They let site staff plug patient data directly into a secure, central system, minimizing transcription errors from the get-go.
- Wearable Devices and Sensors: Think smartwatches tracking heart rates or continuous glucose monitors. These gadgets give us an uninterrupted stream of objective, real-world data that was once impossible to get.
- Electronic Health Records (EHR): Pulling data directly from hospital systems can offer incredible context on a patient’s history. It’s a powerful resource, but it requires extremely careful handling to ensure privacy and accuracy.
This first step sets the tone for everything else. The quality of the data we collect here will directly define the strength of our final analysis.
The Crucial Step: Data Cleaning and Validation
Let's be honest: raw data is never perfect. It comes in messy, full of typos, missing entries, and inconsistencies that have to be sorted out. This is where data cleaning and validation becomes the unsung hero of the entire process.
This stage is all about a systematic review to spot and fix errors. For instance, a validation rule could automatically flag an entry where a patient is listed as both male and pregnant. It's these kinds of logical checks that make sure the dataset is accurate, consistent, and complete before we even think about running a statistical test.
Think of data cleaning as prepping your ingredients before you start cooking. Without clean, high-quality ingredients, even the best recipe will fail. Similarly, without clean data, even the most advanced statistical analysis will produce unreliable results.
This meticulous work is usually handled within a specialized system built specifically to protect the integrity of clinical trial information.
Organizing the Data: A Centralized Approach
When you have data flowing in from multiple sites, sometimes in different countries, just keeping it all straight is a massive challenge. This is why a Clinical Data Management System (CDMS) is so important. It acts as the single, validated source of truth for all trial data. It’s much more than a simple database; it’s a controlled environment with rock-solid audit trails that log every single change.
That "chain of custody" we talked about? The CDMS is what maintains it. It documents who changed what, when they did it, and why. This level of traceability is non-negotiable for regulatory inspections, as it proves the data is authentic and the final dataset truly reflects what happened in the trial.
With research going global, this centralized approach has become more critical than ever. More and more trials are massive, multinational efforts that produce huge, diverse datasets. As of October 2025, the world's largest trial registry lists over 556,000 studies, and a staggering 56% of them are being conducted outside the U.S. alone. You can see just how complex this has become when you explore detailed clinical trial trends and charts. This global scale makes a robust CDMS and a clear workflow absolutely indispensable.
How AI Is Changing the Game in Data Analysis

While traditional statistics form the bedrock of our work, Artificial Intelligence (AI) and Machine Learning (ML) are adding an entirely new dimension to clinical trial analysis. These tools aren't here to replace seasoned experts. Instead, think of AI as a powerful collaborator—a tireless analyst that can dig through massive, complex datasets at a speed and scale that no human team could ever hope to match.
This partnership is a game-changer. It helps researchers spot subtle patterns, faint signals, and hidden correlations that would otherwise go completely unnoticed. It’s like being able to see the entire forest from above instead of just examining one tree at a time. By finding these previously invisible links in patient data, AI is helping us move toward more personalized medicine and smarter trial designs.
Predictive Analytics for Sharper Trial Design
One of the most exciting applications of AI is in predictive analytics. This is where we train ML models on historical trial data to forecast what might happen next. It isn't fortune-telling; it's about making highly educated, data-driven predictions that can optimize a trial right from the get-go.
These predictive models can make a real difference in a few key areas:
- Smarter Site Selection: AI can analyze demographic data and past performance to pinpoint which clinical sites are most likely to enroll the right patients quickly, helping avoid those infamous, costly delays.
- Better Recruitment Forecasting: Models can predict enrollment rates with surprising accuracy, giving sponsors a heads-up if they need to adjust their strategy to stay on track.
- Spotting At-Risk Participants: By identifying patients who are more likely to drop out, AI allows clinical teams to step in with support, improving retention and data quality.
This stuff is quickly moving from "nice-to-have" to standard practice. In fact, many in the field expect AI-driven tasks like protocol automation to be mainstream by 2025. We're already seeing generative AI automate tedious data entry, which is helping to shorten study timelines. As you can read in other predictions on the future of AI, this shift allows research teams to put their resources where they matter most.
Finding Gold in Unstructured Data
A massive trove of valuable information in healthcare is locked up in places like clinician's notes, patient diaries, and pathology reports. This "unstructured" data is incredibly rich with detail but has always been a nightmare to analyze systematically.
Enter Natural Language Processing (NLP), a specialized branch of AI. NLP algorithms are designed to read and understand human language, pulling out the important bits. For a clinical trial, this means we can now automatically extract key data points—like descriptions of adverse events or specific patient outcomes—from thousands of pages of text. It's about turning messy, qualitative notes into clean, structured data we can actually analyze.
Think of AI as a translator. It takes the messy, unstructured human language from clinical notes and converts it into the clean, organized data that statistical models need to do their job. This opens up a huge new source of evidence that was pretty much untouchable before.
Facing the New Hurdles
Of course, bringing AI into a field as tightly regulated as clinical research comes with its own set of challenges. The "black box" problem is a big one. Some complex models can spit out an answer without showing their work, which is a non-starter for regulatory bodies that demand transparency.
Another major hurdle is model validation. Just like any analytical tool, an AI model has to be put through its paces. It needs to be rigorously tested and validated to prove it's accurate, reliable, and free from bias before it can ever be used to support a submission to the FDA or EMA. The industry is working hard to build frameworks that ensure these powerful tools are used responsibly, always keeping scientific rigor and patient safety front and center.
Meeting Regulatory and Compliance Standards
When you're analyzing clinical trial data, the numbers can't just speak for themselves—they have to speak the right language. That language is dictated by a rigid set of regulatory standards designed to protect patients and guarantee that the results are trustworthy. Getting this right isn't just about ticking boxes; it's the very foundation of credible research.
Think of it like building a house. You don't just start throwing bricks down randomly. You have to follow a precise blueprint and meet specific building codes. Why? To make sure the house is safe and won't fall down. In clinical research, these regulatory standards are the blueprint we can't ignore. They ensure the integrity of the whole process.
These rules touch everything, from the moment data is first collected to how the final analysis is reported. A misstep anywhere along the way can lead to a rejected submission, which can mean millions of dollars and years of hard work down the drain.
The Cornerstone of Good Clinical Practice
At the heart of all this is Good Clinical Practice (GCP). It’s the international gold standard for the ethics and science behind trials involving people. GCP’s main job is simple but critical: to protect the rights, safety, and well-being of every single trial participant.
At its core, GCP creates a culture of obsessive documentation and transparency. It demands a clear, traceable record for every piece of data. This creates an audit trail that lets regulators reconstruct the entire trial from beginning to end. This level of transparency is what gives everyone confidence that the final clinical trial data analysis is built on solid, ethically gathered information.
"Compliance is not an act, but a habit. In clinical trials, this habit is built on a foundation of clear protocols, rigorous data validation, and an unwavering commitment to patient safety and data integrity."
This commitment also means locking down the digital systems that hold sensitive patient data. For truly robust protection, it's essential to follow best practices for secure password storage in databases. This prevents unauthorized access and keeps patient information confidential, which is a non-negotiable part of GCP.
Speaking the Same Data Language with CDISC
When it's time to submit trial data to a regulatory body like the FDA or the EMA, you can't just email over a bunch of spreadsheets. The data has to be formatted in a very specific, standardized way so reviewers can make sense of it quickly. That's where the Clinical Data Interchange Standards Consortium (CDISC) comes in.
CDISC has developed a global set of standards that act as a universal translator for clinical trial data. It ensures everyone is speaking the same data language. The two most important CDISC models you'll encounter are:
- Study Data Tabulation Model (SDTM): This standard dictates how to organize the raw, subject-level data collected on case report forms. It’s the first step in getting the data in order.
- Analysis Data Model (ADaM): This standard defines the structure for the datasets that are actually ready for statistical analysis. It creates a clear, traceable path from the raw data to the final results.
Following CDISC standards isn't just a good idea anymore; for many submissions, it's mandatory. It makes the entire review process faster, improves the quality of the data, and ensures the results are completely transparent and reproducible. Without this common framework, regulators would be stuck trying to decipher thousands of different data formats—a nightmare that would grind the drug approval process to a halt.
Proven Best Practices for Your Analysis
Running a flawless clinical trial data analysis isn't just about number-crunching. It's about a disciplined, principled approach that starts long before you ever see the final dataset. Sticking to established best practices is what makes the difference between a study that stands up to scrutiny and one that falls apart under pressure. Think of these principles as the guardrails that keep your work credible and your findings defensible.
The absolute cornerstone of good practice is finalizing a Statistical Analysis Plan (SAP) before anyone writes a single line of analysis code. The SAP is your roadmap, your constitution for the entire analysis. It’s a detailed document that spells out every statistical method you plan to use, how you'll deal with inevitable missing data, and precisely which endpoints you're testing. This is your best defense against bias.
Pre-Specify Your Endpoints to Avoid Bias
A crucial part of that SAP is pre-specifying your primary and secondary endpoints. This means deciding exactly what you’re going to measure to judge success before the data is unblinded. Why is this so important? It prevents a nasty habit known as "data dredging" or "p-hacking," where researchers keep running tests until something, anything, shows up as statistically significant just by chance.
When you pre-specify endpoints, you're locking in your scientific question from the get-go. It ensures your conclusions come from a focused, hypothesis-driven investigation, not from an aimless fishing trip. It’s a non-negotiable part of scientific integrity.
Confirm Your Findings with Sensitivity Analyses
So, you have your primary results. But how do you know they’re solid? That's where sensitivity analyses come into play. These are basically "what if" scenarios. You re-run your analysis using slightly different, but still valid, assumptions to see if your conclusions change.
For instance, you might try a different way of handling missing data or tweak the definition of a patient subgroup.
A sensitivity analysis is like a stress test for your findings. If your main result holds up even when you nudge the analytical assumptions, it gives everyone—from your team to the regulators—a lot more confidence that the effect is real and not just a fluke of your methodology.
Build a Culture of Reproducibility
Ultimately, the gold standard for any analysis is reproducibility. Can another statistician take your raw data and your code and get the exact same results? This isn't just a technical check-in; it's a deep-seated commitment to transparency and quality.
Making this happen comes down to a few key habits:
- Version Control: Use a system like Git to track every single change to your analysis code. This creates a complete, auditable history that shows how the analysis evolved.
- Independent Validation: This is the ultimate test. Have a completely separate programmer re-implement the analysis from scratch using the same data and specifications. It's the best way to catch errors.
- Clear Documentation: Comment your code like the next person to read it has no idea what you were thinking. Document every decision and step so others can follow your logic.
By weaving these practices into your daily workflow, you build a transparent chain of evidence that connects the raw data directly to your final report.
Frequently Asked Questions
Even with a solid grasp of the big picture, you'll always have questions when you get down to the nitty-gritty of clinical trial data analysis. Let's tackle some of the most common ones that come up in practice.
What Is the Difference Between an Interim and a Final Analysis?
Think of it like checking the score of a game at halftime. An interim analysis is a planned peek at the data while the trial is still running. It’s not the final word, but it gives an independent group, like a Data and Safety Monitoring Board (DSMB), a chance to see if the treatment is overwhelmingly effective or if there are unexpected safety concerns.
Based on what they find, the DSMB might recommend stopping a trial early. A final analysis, on the other hand, is the main event. It only happens after the last patient has finished the study and every piece of data has been collected, cleaned, and locked. This is what provides the definitive results you submit to regulatory agencies.
How Do You Handle Missing Data in a Clinical Trial?
Ah, the million-dollar question. Missing data is one of the thorniest issues we face, and how you handle it can make or break the integrity of your results. There's no one-size-fits-all answer; the right approach depends entirely on why the data is missing in the first place. Critically, you must define your strategy in the Statistical Analysis Plan (SAP) before you even look at the data to avoid cherry-picking a method that gives you the answer you want.
Outdated methods like Last Observation Carried Forward (LOCF) are largely a thing of the past because we now know they can seriously skew results. Today, the gold standards are much more sophisticated:
- Multiple Imputation (MI): Instead of just guessing a single value, this technique creates several plausible complete datasets. It fills in the blanks with estimated values, and by analyzing all these datasets, we get a result that properly accounts for the "what if" uncertainty of the missing information.
- Mixed-Models for Repeated Measures (MMRM): This is a powerful statistical model that can analyze the data even with gaps, without having to fill them in at all (under certain statistical assumptions, of course).
"Your strategy for handling missing data is not an afterthought; it is a critical, pre-specified decision that directly impacts the validity of a trial's conclusions. Choosing the right method ensures the results are robust and credible."
What Are CDISC Standards and Why Are They Important?
Imagine everyone at the UN speaking a different language with no translators—it would be chaos. That's what clinical research would be like without CDISC, the Clinical Data Interchange Standards Consortium. It provides a universal language for clinical trial data. These global standards create a consistent blueprint for organizing and formatting data, no matter who or where it comes from.
Two of the most important blueprints you'll hear about are:
- SDTM (Study Data Tabulation Model): This is the standard for organizing the raw data collected from each participant.
- ADaM (Analysis Data Model): This standard structures the data specifically for statistical analysis, making it "analysis-ready."
Following these standards isn't just good practice; it's often a requirement. Regulatory bodies like the FDA and EMA rely on this predictable format to review submissions efficiently. When data is in a CDISC-compliant format, it makes the entire review process faster, improves data quality, and ensures the analysis is completely transparent and traceable from start to finish.
At PYCAD, we live and breathe this stuff. We specialize in applying advanced AI to tough medical imaging challenges, from meticulous data annotation to deploying sophisticated models. We help medical device companies and researchers uncover insights that were previously out of reach. Discover how our AI solutions can elevate your projects at https://pycad.co.