
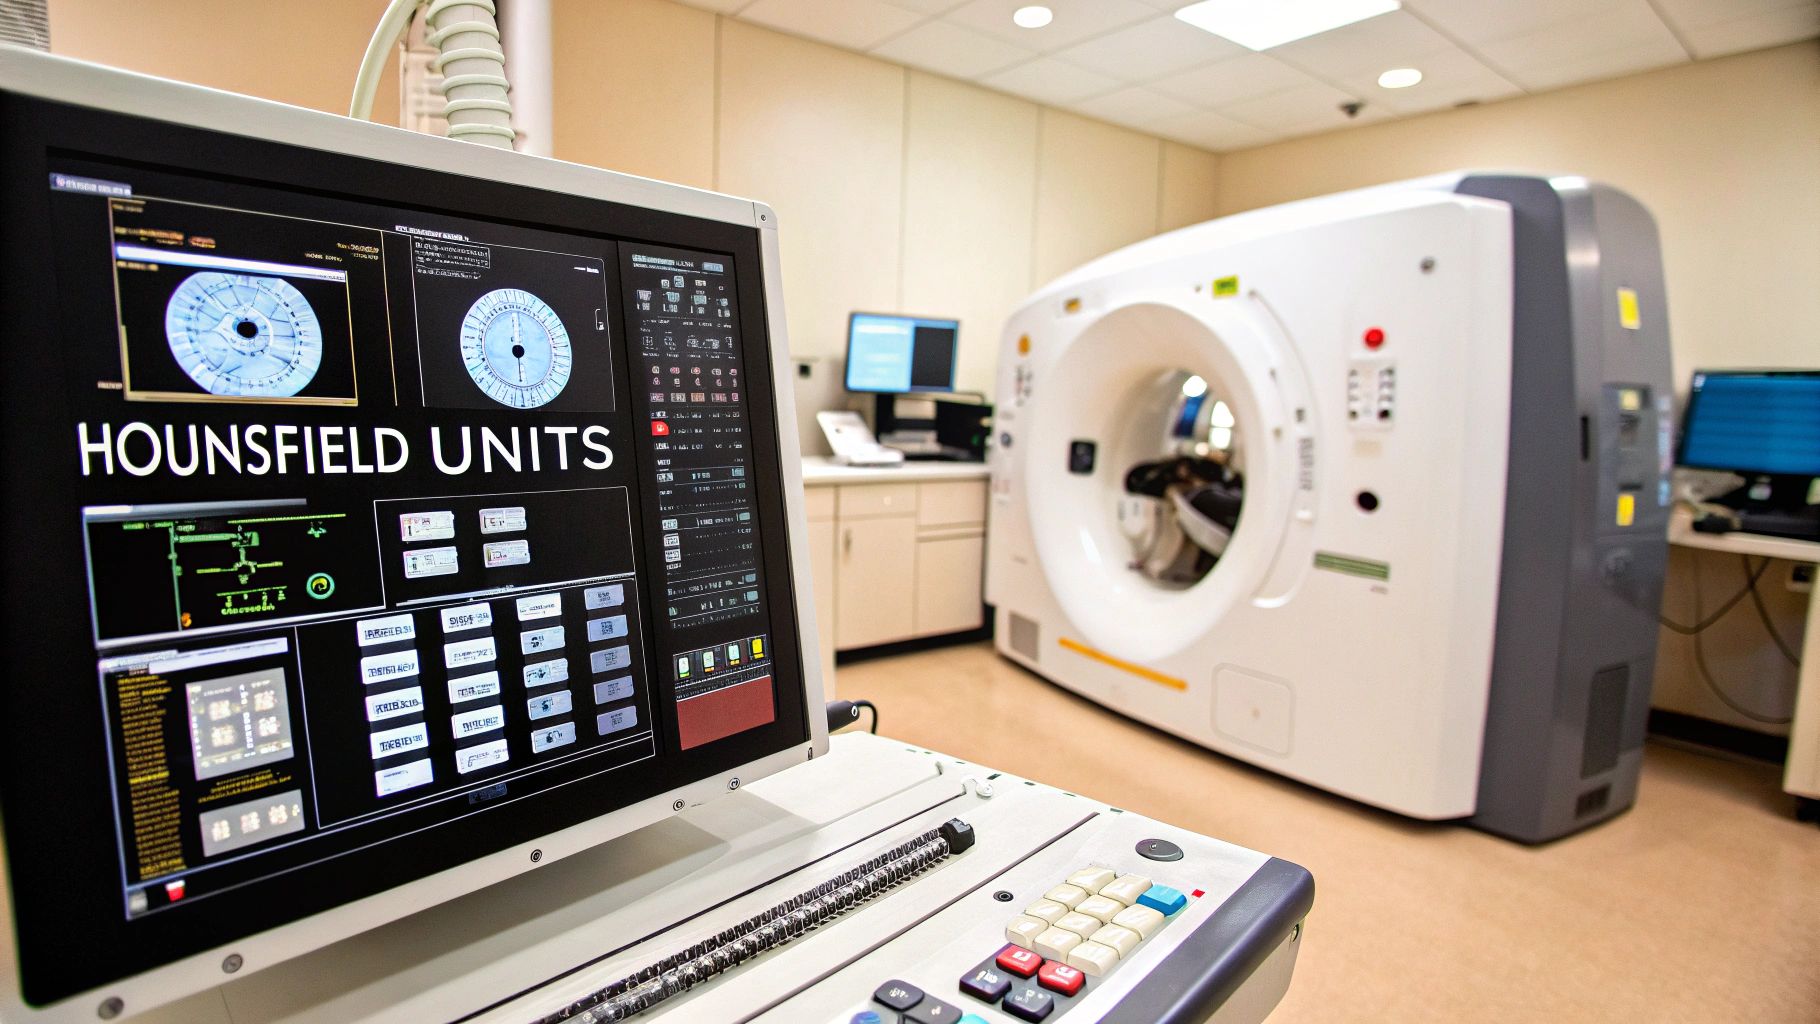
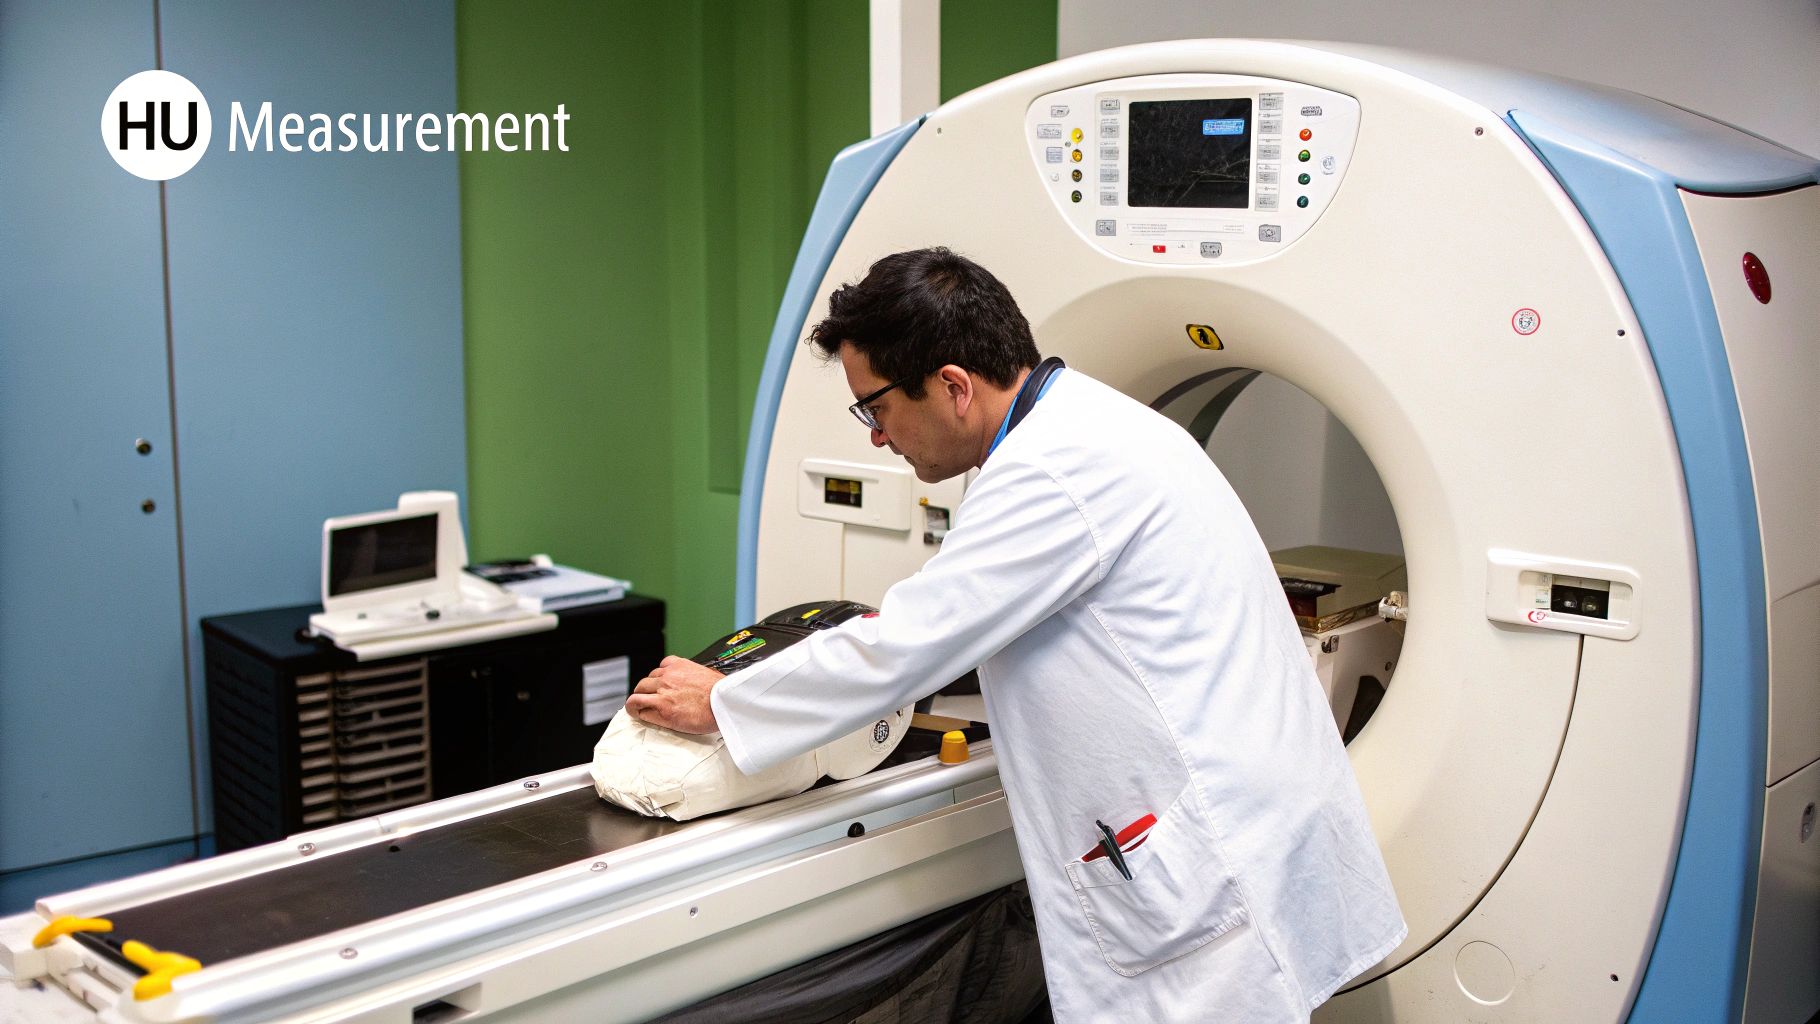
When you look at a CT scan, you see a detailed grayscale image of the inside of the human body. But how does a doctor know if they're looking at healthy tissue, a tumor, or a bleed? That's where Hounsfield Units (HU) come in.
Think of the Hounsfield scale as a universal translator for CT scans. It's a standardized numerical scale that assigns a specific number to every type of tissue based on its density. This simple but brilliant system turns subjective shades of gray into objective, measurable data.
Decoding the Grayscale Language of CT Scans
The real magic of the Hounsfield scale is its consistency. Just like Celsius gives us a standard way to talk about temperature anywhere in the world, Hounsfield Units provide a reliable benchmark for tissue density. This means a radiologist in New York can interpret a scan from Tokyo with the exact same understanding and confidence.
This consistency is built on two fundamental reference points that every CT scanner is calibrated against, ensuring every scan speaks the same language.
The Two Pillars of the HU Scale
The entire scale is anchored by two substances with known, constant densities:
- Distilled Water: This is the zero point of the scale, set at precisely 0 HU. Tissues denser than water will have a positive HU value and look brighter on the scan.
- Air: At the opposite end, air represents the lowest possible density and is assigned a value of -1000 HU. Tissues that are less dense than water will have a negative HU value and appear darker.
By measuring how much X-ray a particular tissue absorbs relative to water and air, the CT scanner can assign it an exact HU value. This transforms the grayscale image into a detailed density map. A dense object like a kidney stone, for instance, might have a high positive value and show up as a bright white spot, making it easy for a doctor to identify.
The Science Behind the Hounsfield Scale
To really get what Hounsfield Units are all about, we have to talk a little bit about physics. The whole system hinges on a concept called X-ray attenuation. It sounds complicated, but it just means that different materials in the body slow down or absorb an X-ray beam to different degrees.
Think of it like shining a flashlight through various objects. A pane of glass barely dims the light, but a thick wooden door blocks it almost completely. It's the same idea with X-rays and the human body. Dense structures like bone are the "wooden doors"—they absorb a lot of the X-ray energy. Softer materials, like fat or air-filled lungs, are more like the "glass pane," letting most of the beam pass right through.
A CT scanner's detectors are incredibly sensitive, measuring precisely how much of the X-ray beam survives its journey through the body from thousands of different angles.
Calculating the HU Value
This is where the magic happens. All that raw data about how much the X-ray beam was weakened is converted into a simple, standardized number using a linear formula. The Hounsfield scale is built around two fixed reference points that anchor every single CT scan, no matter where it's done.
- Pure Water: This is the zero point, the fundamental baseline. It’s calibrated to exactly 0 HU.
- Air: This represents the other extreme—the lowest density imaginable in the body. It’s set to -1000 HU.
With these two goalposts in place, the HU value for every other tissue is calculated based on how much it attenuates X-rays relative to water. This clever normalization is what makes the Hounsfield scale so powerful.
The Hounsfield unit (HU) is a dimensionless measurement named after Sir Godfrey Hounsfield, the inventor of computed tomography. The development of this scale was a critical breakthrough for the first clinical CT model tested back in 1971, giving doctors a reliable way to interpret the new kind of images. You can learn more about the history of the CT scan and its inventor.
Because of this system, a liver scanned on a GE machine in Chicago will show the same HU values as a liver scanned on a Siemens machine in Tokyo. This incredible consistency is the bedrock of modern diagnostic imaging, allowing for reliable and repeatable analysis of CT scans anywhere in the world.
A Visual Guide to Common HU Values
So, how does all this theory play out on an actual CT scan? It's all about translating numbers into a picture. Every single pixel on a CT image has a Hounsfield Unit value, which the computer displays as a specific shade of gray. This creates a detailed map of the body's internal structures, allowing a radiologist to tell different tissues apart almost instantly.
Think of it this way: air is the least dense thing we scan, so it shows up as black with a value of -1000 HU. On the complete opposite end of the spectrum, you have dense cortical bone, which is brilliant white at +1000 HU or even higher. Everything else—organs, muscle, fat, and fluid—falls somewhere in between these two extremes.
This infographic gives a great visual breakdown of where different tissues and substances land on the Hounsfield scale.

As you can see, the distinct HU ranges are what make it possible for doctors to spot anatomical structures and identify abnormalities based on how dense they appear.
Mapping Tissues on the HU Scale
To get a bit more specific, it’s helpful to see the numbers side-by-side. The following table shows the standard Hounsfield Unit (HU) ranges for various biological tissues and substances commonly seen in CT scans, organized from least dense (darkest) to most dense (brightest).
| Substance or Tissue | Typical HU Range |
|---|---|
| Air | -1000 HU |
| Lung Tissue | -700 to -500 HU |
| Fat | -100 to -50 HU |
| Water | 0 HU |
| Cerebrospinal Fluid (CSF) | +8 to +15 HU |
| Kidney | +20 to +40 HU |
| Blood (Acute) | +55 to +75 HU |
| Muscle | +35 to +55 HU |
| Liver | +50 to +70 HU |
| Soft Tissue | +30 to +80 HU |
| Calcification / Stone | +100 to +400 HU |
| Cortical Bone | +1000 HU or more |
Knowing these general ranges is a game-changer for anyone reading a CT scan. It transforms the image from just a picture into a set of measurable data.
For instance, if a radiologist spots an area in the abdomen with a value of -90 HU, they know immediately it’s fat. A reading of +65 HU inside a blood vessel? That could signal a fresh blood clot, which is much denser than the surrounding flowing blood.
This is the real power of Hounsfield Units. It’s the key to understanding the visual language of CT imaging and allows clinicians to make diagnoses based on quantifiable, objective data.
How Doctors Use HU for Real-World Diagnoses
This is where the rubber meets the road. Beyond the physics and technical charts, Hounsfield Units are a fundamental tool that clinicians depend on every single day to make critical, life-saving calls. The numbers on the scale translate directly into patient care, turning what looks like a simple grayscale image into a detailed diagnostic roadmap.
For a trained radiologist, recognizing when a tissue's HU value falls outside its normal range is the key to spotting trouble.
Imagine a patient comes in with severe flank pain. A CT scan is ordered to look for kidney stones. These calcified deposits are incredibly dense, often clocking in at +400 HU or even higher. On the scan, a kidney stone shines like a bright white speck against the much softer, darker gray of the kidney tissue, which typically sits around +30 HU. The diagnosis is immediate and undeniable.
Differentiating Tissues and Fluids
The true diagnostic power of the Hounsfield scale really comes to light when a doctor needs to tell the difference between various types of masses or fluid collections. A quick measurement with the software's region-of-interest tool can reveal vital clues about what they're looking at.
Here are a couple of common clinical scenarios:
-
Cyst vs. Tumor: Is that spot on the kidney a harmless, fluid-filled cyst or something more sinister? A simple cyst will have an HU value very close to water, usually between 0 and +20 HU. A solid tumor, on the other hand, is made of dense cellular tissue and will have a much higher reading—typically +40 to +80 HU. This one number instantly changes the conversation and directs the next steps in a patient's care.
-
Spotting Internal Bleeding: After a car accident or a bad fall, doctors need to know if there's internal bleeding. Freshly clotted blood is surprisingly dense, measuring between +55 and +75 HU. This makes it appear noticeably brighter than surrounding organs like the liver or spleen, allowing for the rapid detection of a life-threatening hemorrhage.
By giving us a standardized, universal language for interpreting scans, the Hounsfield unit became instrumental in modern medicine. Its creation totally changed the game, offering safer and more precise diagnoses that made many older, more invasive procedures obsolete. This system remains vital for everything from evaluating brain injuries to staging cancer. You can learn more about the impact of standardized CT imaging on modern medicine.
Ultimately, HU values take the guesswork out of reading a CT scan. They provide objective, quantitative data that helps doctors confidently tell the difference between dozens of conditions, making sure patients get the right diagnosis and treatment as quickly as possible.
Why HU Values Aren't Always Set in Stone
While the Hounsfield scale gives us a standardized way to look at CT scans, the numbers we see aren't always absolute. Think of it less like a rigid ruler and more like a sensitive instrument that can be influenced by its environment. Several real-world factors can nudge these values up or down, and a good radiologist knows exactly what to watch for.
The Physics of the Scan
One of the biggest culprits behind shifting HU values is a physics phenomenon called beam hardening. When the scanner's X-ray beam travels through something incredibly dense—like bone or a metal hip replacement—the lower-energy parts of the beam get absorbed.
What’s left is a "hardened" beam with higher average energy. This more powerful beam can make nearby soft tissues look artificially darker (and thus have a lower HU number) than they actually are. It's a subtle but important artifact that can mimic disease if you don't account for it.
Clinical and Patient-Specific Variables
It's not just physics, either. Things we do in the clinic and variations between patients also play a huge role.
- IV Contrast Agents: This is an intentional change. We often inject an iodine-based contrast agent into a patient's bloodstream. This dense liquid makes blood vessels and organs light up bright white on the scan, dramatically increasing their HU values to help us see them more clearly.
- Patient Factors: People come in all shapes and sizes. A patient’s overall size and body composition can slightly change how X-rays are attenuated, leading to small but noticeable differences in HU readings from one person to the next.
- Scanner Calibration: Just like any piece of high-tech equipment, different CT scanners can have tiny variations in their setup and energy settings. This can also cause minor discrepancies in the final HU measurements.
This is exactly why reading a CT scan is both a science and an art. A seasoned radiologist never just looks at the raw numbers. They weigh these potential variations against the patient's full clinical picture to form a complete and accurate diagnosis.
In the end, these variables don’t undermine the Hounsfield scale's usefulness. They simply reinforce the importance of expert human interpretation in making sense of the incredible detail a CT scan provides.
Your Top Questions About Hounsfield Units, Answered
Once you get the hang of what Hounsfield Units are, the practical questions start popping up. Let's dive into a few of the most common ones to clear up how these numbers work in the real world.
Can Hounsfield Units Diagnose Cancer?
This is a big one, and the answer is no—at least, not by themselves. While HU values are an incredibly powerful clue, they aren't the final word on a cancer diagnosis.
For instance, a lesion with a value around 0 HU is almost certainly a simple, fluid-filled cyst. On the other hand, a solid mass will have a much higher HU reading. This measurement helps a radiologist get a sense of what they're looking at, but it's just one piece of the puzzle.
A definitive diagnosis always brings together multiple sources of information: the full range of imaging findings, the patient's medical history, and ultimately, a biopsy sent to a lab for analysis.
Think of the HU value as an expert tip-off, not the final verdict. It points doctors in the right direction, helping them distinguish between something that's likely harmless and something that needs a closer look.
This is a perfect example of how raw data from a CT scan is only truly powerful when a skilled clinician interprets it within the full clinical picture.
Do All CT Scanners Give the Same HU Values?
In a perfect world, yes. In reality, there are tiny variations. The Hounsfield scale is built on two universal reference points: pure water is always 0 HU, and air is always -1000 HU. Every scanner out there is calibrated against this standard, which keeps things remarkably consistent across the globe.
That said, you can get slight drifts from machine to machine. Things like the scanner's age, its specific calibration on a given day, or the energy settings used for a scan can introduce minor differences. Radiologists are trained for this; they know how to account for these small tolerances. The scale is so well-designed that these tiny shifts don’t throw off their diagnostic accuracy.
What Does "Windowing" an Image Mean?
You'll often hear radiologists talk about "windowing" a CT image. This is a neat digital trick they use to zero in on specific tissues by changing the range of Hounsfield Units displayed on the monitor. The human eye can only see so many shades of gray, but a CT scan captures thousands of different HU values.
Windowing lets a radiologist pick a specific "window" of HU values they want to see in detail. For example:
- Bone Window: To get a sharp look at the skeleton, they'll set a window centered on high HU values. This makes the bones pop with incredible detail while softer tissues fade into the background.
- Lung Window: To inspect the delicate, air-filled structures of the lungs, they’ll switch to a window centered on very low HU values.
It’s a powerful tool that lets them essentially "tune" the image to the exact tissue they need to evaluate, making sure no subtle detail gets missed.
At PYCAD, we develop AI solutions that sharpen the analysis of medical imaging data, including Hounsfield Units. We partner with medical device companies to help them improve diagnostic accuracy and efficiency through better data handling and model deployment. See how our AI services can support your next project.