What if you could peer into a patient's health and accurately predict what's coming? In medical diagnostics and AI, that's precisely the goal. Sensitivity and specificity are the two cornerstones we rely on to measure just how well a test or an algorithm can do that.
Think of it this way: sensitivity is a tool's ability to correctly find everyone who actually has a condition. At the same time, specificity is its power to correctly clear everyone who is healthy.
Decoding Diagnostic Accuracy: A Simple Analogy
Let's imagine an expert art detective tasked with a monumental job: combing through a massive gallery to find every single forgery while correctly identifying every authentic masterpiece. This high-stakes mission perfectly illustrates the delicate dance between sensitivity and specificity.
Sensitivity is the detective's knack for spotting every last forgery. If 10 fakes are hiding among hundreds of paintings, a detective with high sensitivity will hunt down all 10. The mission is simple: let no forgery (the "positive" case) slip through the cracks. Missing one—a "false negative"—could be catastrophic, letting a worthless painting be sold for millions.
Specificity, on the other hand, is the detective's skill in correctly labeling every authentic masterpiece without raising a false alarm. A detective with high specificity won't mistakenly flag a genuine Monet as a fake. That kind of mistake—a "false positive"—would tarnish the reputation of a priceless artwork and create unnecessary chaos.
The Foundation of Trust in Diagnostics
This balancing act is the very foundation of trust in any diagnostic system, from simple medical tests to complex AI models. To see how these concepts play out in the real world, it helps to understand what a cognitive assessment entails, as these tests depend heavily on getting this balance right.
The ideas themselves aren't new; they come from a long history in biostatistics. Sensitivity is also known as the true positive rate, measuring how many actual positives a test correctly identifies. Specificity is the true negative rate, measuring how many actual negatives it gets right.
In diagnostics, your goal is to minimize the most harmful type of error. Whether you prioritize finding every positive case or avoiding every false alarm depends entirely on the stakes of the situation.
This principle is absolutely critical when building reliable medical technology. For example, maintaining robust medical imaging quality assurance is all about optimizing this balance for the best patient outcomes.
Quick Guide to Sensitivity vs Specificity
To make it even clearer, here’s a quick summary to help you distinguish between these two core concepts at a glance.
| Metric | What It Measures | Answers the Question | Goal |
|---|---|---|---|
| Sensitivity | The ability to correctly identify true positives. | "Of all the people who are sick, how many did the test correctly identify?" | Avoid missing a diagnosis (False Negatives). |
| Specificity | The ability to correctly identify true negatives. | "Of all the people who are healthy, how many did the test correctly clear?" | Avoid misdiagnosing healthy people (False Positives). |
Mastering these metrics isn't just an academic exercise—it's about building tools that clinicians can trust to make life-changing decisions. It’s a commitment to precision that drives our work at PYCAD, where we build custom web DICOM viewers and integrate them into medical imaging web platforms. Our tools are built on an unwavering foundation of accuracy, a mission you can see reflected in our portfolio.
The Confusion Matrix: A Visual Blueprint for Performance
To really get a handle on what is sensitivity and specificity, we have to go beyond dictionary definitions and see them in action. This is where the confusion matrix comes in. Think of it less as a boring table of numbers and more as a visual story of your model's wins and losses. It’s the raw, honest truth that lets you calculate just about every performance metric that matters.
Let's imagine a sophisticated medical AI built to spot tumors in brain scans. Every single time it looks at an image, its prediction lands in one of four buckets. The confusion matrix neatly organizes these outcomes into a simple but powerful 2×2 grid, giving us a clear blueprint of the AI's real-world performance.
Breaking Down the Four Quadrants
Let’s pull back the curtain on this grid and look at each of its four essential quadrants. Each one tells a critical piece of the story about our tumor-detecting AI.
- True Positives (TP): These are the home runs. The model sees a tumor that’s actually there. For a patient who needs immediate treatment, this is a life-changing win.
- True Negatives (TN): These are the sighs of relief. The model correctly sees that there's no tumor. This brings peace of mind and, just as importantly, prevents unnecessary and stressful follow-up procedures.
Those first two quadrants are what we’re aiming for—correct predictions. But the next two are where the real learning happens, because they show us exactly where the model is falling short.
- False Positives (FP): This is a false alarm. The model flags a tumor, but the scan is perfectly healthy. This kind of error can trigger immense anxiety for the patient and lead to costly, invasive, and ultimately needless tests. It's often called a Type I error.
- False Negatives (FN): This is the one we fear the most. A tumor is present, but the model completely misses it. This is a critical failure that can delay life-saving treatment, with potentially devastating consequences. This is a Type II error.
This concept map helps visualize the core tension between finding all the fakes (sensitivity) and correctly identifying all the genuine articles (specificity), just like a skilled art detective.
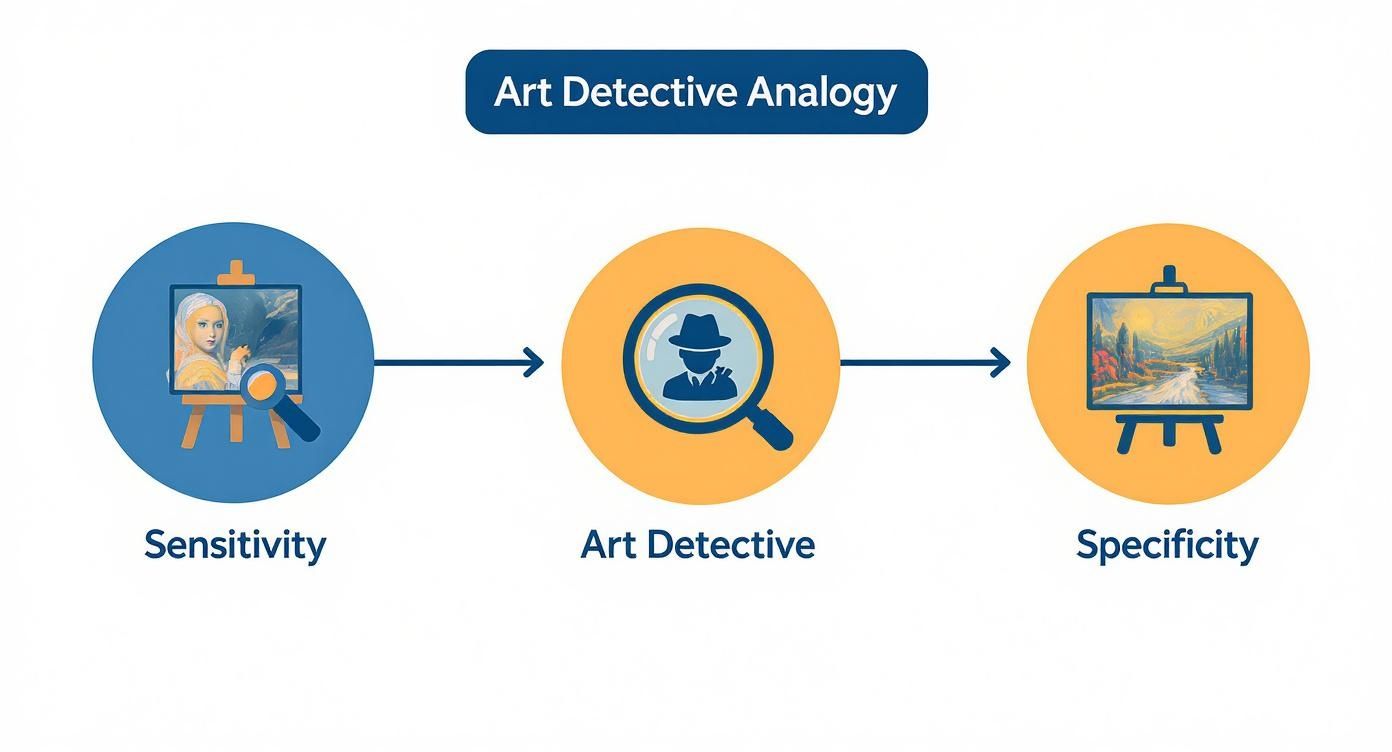
The visualization really drives home how sensitivity is all about catching positives (the forgeries), while specificity is focused on correctly clearing the negatives (the masterpieces). You can see they are two distinct, and sometimes competing, goals.
Why the Matrix is a Storyteller
By laying out these four outcomes so clearly, the confusion matrix does something a single accuracy score never could: it reveals the character of a model’s mistakes. It answers the crucial questions, like, "Is this AI more prone to crying wolf, or is it more likely to be asleep on the job?" That level of detail is everything.
The confusion matrix transforms abstract performance data into a tangible story. It shows not just if a model is wrong, but how it's wrong—and that’s essential for building diagnostic tools people can actually trust.
This deep, granular understanding is at the heart of what we at PYCAD do. When we build custom web DICOM viewers and integrate them into medical imaging web platforms, this kind of rigorous performance analysis isn't just a nice-to-have; it's a must. For a deeper dive, check out our guide on machine learning model evaluation.
Getting comfortable with this visual map empowers developers and clinicians to look past a single number and truly grasp how a diagnostic tool will behave when it matters most. Coming up, we’ll show you exactly how to use the numbers from this matrix to calculate sensitivity and specificity for yourself.
Mastering Sensitivity: The Power to Detect
When we talk about the performance of a diagnostic test or an AI model, sensitivity is the ultimate "detector." It answers one of the most critical questions you can ask: "Of all the people who actually have the condition, how many did we successfully catch?"
Imagine a smoke detector. You want it to be incredibly sensitive. Its one job is to never miss a real fire, even if it occasionally gets triggered by burnt toast. That's the essence of sensitivity—its mission is to find the real thing.
We calculate this metric using a straightforward formula that zeroes in on the people who truly have the condition. It’s all about the actual positives.
Sensitivity = True Positives / (True Positives + False Negatives)
What this really tells us is the percentage of actual positive cases our model correctly identified. A high sensitivity score means your model is a fantastic detective, minimizing the number of dangerous misses—what we call False Negatives (FN).
A Practical Example: Calculating Sensitivity
Let's make this real. Say we've built a medical AI to spot tumors in patient scans. The AI processes 1,000 scans, and we know that 100 of those patients genuinely have a tumor. Here’s how the AI performed on that group:
- True Positives (TP): The AI correctly flagged 95 of the scans with tumors.
- False Negatives (FN): Unfortunately, the AI missed 5 scans that did have tumors.
Now, let's pop these numbers into our formula.
-
First, find the total number of actual positive cases. That’s just True Positives + False Negatives (95 + 5 = 100).
-
Next, grab the number of correctly identified positives. That’s our True Positives count, which is 95.
-
Finally, do the math:
Sensitivity = 95 / (95 + 5)
Sensitivity = 95 / 100
Sensitivity = 0.95 or 95%
A sensitivity of 95% is a fantastic result. It tells clinicians that this AI successfully identified 95% of all real tumors in the dataset. That gives them a high degree of confidence, especially when a test comes back negative.
High sensitivity is the bedrock of screening. When the cost of missing a condition is severe, you need a test that casts a wide net to catch every possible case. A negative result from a highly sensitive test is a powerful statement of reassurance.
Why High Sensitivity Is Non-Negotiable
In some situations, high sensitivity isn't just a nice-to-have; it's a clinical and moral imperative. Think about screening for serious but treatable diseases like early-stage cancer or infectious outbreaks. In these cases, a false negative isn't merely a statistic. It’s a person who might miss the window for life-saving treatment.
This is why sensitivity is king in critical diagnostic applications. It’s about a commitment to patient safety, making sure no stone is left unturned. It’s this same drive for precision that fuels our work at PYCAD, where we build custom web DICOM viewers and integrate them into medical imaging web platforms. Our goal is to create tools that give clinicians the visual clarity to catch every detail, without compromise. You can see this dedication in action across our portfolio.
Ultimately, mastering sensitivity is about building trust. It’s about creating diagnostic tools that give both doctors and patients the confidence that a "clear" result truly means they are in the clear.
Understanding Specificity: The Power to Confirm
If sensitivity is our eagle-eyed spotter, then specificity is the calm, confident expert who gives the all-clear. It answers a profoundly important question: "Of all the people who are actually healthy, how many did our test correctly identify as healthy?" Specificity is our shield against false alarms, the metric that builds confidence and prevents needless worry.
Think of it as the final, decisive check at an airport security gate. The goal isn't just to find a problem; it's to do so without flagging every innocent person who walks through. A system with poor specificity would be chaos, causing massive delays and distress by constantly pulling people aside for no reason. High specificity is what lets everyone else move forward with confidence, knowing that when an alarm does sound, it's for real.

The formula for specificity zeroes in on the true negative group, measuring how well our model avoids putting a "sick" label on a healthy person.
Specificity = True Negatives / (True Negatives + False Positives)
This calculation tells us the exact percentage of healthy cases that our model correctly cleared. A high specificity score means the model is brilliant at recognizing what's normal, dramatically reducing the number of costly and stressful False Positives (FP).
Calculating Specificity in Action
Let’s go back to our AI analyzing 1,000 scans. We know 100 patients had tumors, leaving 900 patients who were perfectly healthy. On this healthy group, the AI performed as follows:
- True Negatives (TN): It correctly gave the all-clear to 882 of the healthy scans.
- False Positives (FP): It mistakenly flagged 18 healthy scans as suspicious.
With these figures, we can pin down its specificity.
-
First, let's find the total number of actually healthy people. That's our True Negatives plus our False Positives (882 + 18 = 900).
-
Next, we grab the number of people it correctly identified as healthy—our True Negatives count of 882.
-
Now, we just plug those numbers into the formula:
Specificity = 882 / (882 + 18)
Specificity = 882 / 900
Specificity = 0.98 or 98%
A specificity of 98% is fantastic. It tells us the AI is incredibly trustworthy when it says everything is fine, correctly clearing 98% of all healthy patients and raising very few false alarms.
Why High Specificity Is a Pillar of Trust
High specificity is non-negotiable when a positive result leads to serious next steps—think invasive biopsies, expensive follow-up procedures, or life-changing treatments. A test with low specificity would swamp the healthcare system with false positives, draining resources and causing unimaginable anxiety for patients who were healthy all along.
This is precisely why you see specificity and sensitivity used as gold-standard metrics in global healthcare. For example, a COVID-19 PCR test might have a sensitivity between 70% and 95%, but its specificity often tops 99%. This means it's exceptionally good at confirming who is not infected, preventing healthy people from being isolated without reason. You can explore the data on diagnostic test performance to see how these metrics play out in the real world.
High specificity builds immense trust in a positive result. When a test almost never gets it wrong for healthy individuals, a positive flag carries incredible weight. It ensures that medical care is directed only to those who truly need it.
This focus on reliable confirmation is at the heart of what we at PYCAD do. We build custom web DICOM viewers and integrate them into medical imaging web platforms knowing that every single prediction matters. Our goal is to arm clinicians with tools that are not just great at finding a problem, but exceptional at confirming its absence—a philosophy you can see woven into our PYCAD portfolio.
The Sensitivity and Specificity Trade-Off
In diagnostics, you can’t have it all. Improving sensitivity often comes at the cost of specificity, and vice-versa. Think of them as two ends of a seesaw—when one goes up, the other inevitably comes down. Mastering this delicate balance is one of the most crucial skills for anyone working with diagnostic tests or medical AI.
Let's try an analogy. Imagine you're a sound engineer trying to record a faint whisper in a busy room. If you crank the microphone's sensitivity way up to catch that whisper (high sensitivity), you'll also pick up every other sound—the air conditioner humming, a distant siren, someone shuffling their feet (low specificity).
On the other hand, if you turn the sensitivity way down to filter out all that background noise, you risk missing the very whisper you were trying to capture. This constant push and pull is exactly what clinicians and data scientists face every single day.
Visualizing the Balance with ROC Curves
So how do we find the right balance? Data scientists have a brilliant tool for this called the Receiver Operating Characteristic (ROC) curve. This graph gives us a visual representation of the trade-off, plotting the true positive rate (sensitivity) against the false positive rate (1-specificity) across a range of different settings.
A perfect test would rocket straight to the top-left corner of the graph, representing 100% sensitivity and 100% specificity. Of course, perfection is a rare guest in the real world. The curve helps us identify the "sweet spot" for our specific needs, allowing us to tune a model to favor one metric over the other, depending on which type of error is more dangerous.
When to Prioritize Sensitivity vs Specificity
Deciding which metric to prioritize isn't a one-size-fits-all problem. The choice depends entirely on the context and, most importantly, the consequences of getting it wrong. The stakes of the situation dictate everything.
The table below breaks down a few real-world medical scenarios to show how clinicians decide which metric is more critical.
When to Prioritize Sensitivity vs Specificity
| Scenario | Primary Goal | Metric to Prioritize | Reasoning |
|---|---|---|---|
| Early Cancer Screening | Detect every possible case, no matter how subtle. | Sensitivity | Missing a case (False Negative) could delay life-saving treatment, a far worse outcome than a false alarm. |
| Confirming a Rare Disease | Be absolutely certain before starting aggressive treatment. | Specificity | A false alarm (False Positive) could lead to unnecessary, invasive procedures and immense patient anxiety. |
| Rapid Flu Test in an Outbreak | Quickly identify infected individuals to control spread. | Sensitivity | It's better to isolate a few healthy people than to let infected individuals unknowingly spread the virus. |
| Pre-Surgical Blood Type Test | Ensure a perfect match to prevent a fatal reaction. | Specificity | A positive result must be completely trustworthy. There is no room for a false positive in this scenario. |
As you can see, the "best" model is the one that is best suited for the job at hand.
This expertise in finding the perfect diagnostic balance is at the heart of what we at PYCAD do. When we build custom web DICOM viewers and integrate them into medical imaging web platforms, we know that the models must be finely tuned for their specific purpose.
Whether a tool is designed for early screening (demanding high sensitivity) or for confirming a diagnosis (requiring peak specificity), our systems are built to deliver the right kind of accuracy. This dedication ensures clinicians have tools they can genuinely trust. To see how we put these principles into practice, take a look at our work in the PYCAD portfolio.
Understanding this trade-off is what elevates us from simply knowing what is sensitivity and specificity to using that knowledge to make inspired, life-changing decisions.
Going Beyond the Basics
To truly get a handle on a model's performance, we need to move past the fundamentals of sensitivity and specificity. While they're the bedrock of diagnostic accuracy, they don’t give us the complete picture. A richer set of metrics is needed to see how a test or model will actually perform out in the real world.
This is where we bring clinical context into the conversation, shifting from pure theory to practical impact. These advanced metrics are what empower clinicians and data scientists to make smarter, more confident decisions when it matters most.
Predictive Values: What a Test Result Really Means
Let's start with Positive Predictive Value (PPV) and Negative Predictive Value (NPV). Unlike sensitivity and specificity, which are fixed characteristics of a test, these two metrics are heavily swayed by how common a disease is in a given population.
- PPV answers the crucial question on every patient's mind after a positive result: "Now that I have this result, what are the actual odds I have the disease?"
- NPV tackles the opposite concern: "My test was negative, so how sure can I be that I'm actually disease-free?"
Why does this matter? Because prevalence is a game-changer. A test with fantastic sensitivity and specificity can still generate a ton of false alarms if used in a population where the condition is incredibly rare. This is a core idea in model validation, where knowing the environment your model operates in is just as vital as the model itself.
The F1-Score: Finding Balance in Uneven Data
Next up is the F1-Score. This metric is your best friend when dealing with imbalanced datasets—a constant reality in medical imaging, where the "sick" cases are often few and far between. The F1-Score elegantly combines precision (which is closely related to PPV) and recall (which is just another name for sensitivity) into a single, powerful number.
The F1-Score strikes a crucial balance. It helps you weigh the trade-off between finding every single positive case and avoiding too many false positives. It's the perfect metric when you can't afford to sacrifice either one.
This is a go-to for AI developers who need one simple score to fine-tune a model's performance, especially when hunting for rare but critical findings.
Likelihood Ratios: A Clinician's Best Friend
Finally, we have Likelihood Ratios (LRs). These are incredibly practical because they tell a clinician exactly how much a test result should shift their thinking about a diagnosis. They translate a test’s sensitivity and specificity into a Positive Likelihood Ratio (PLR) and a Negative Likelihood Ratio (NLR). In the clinic, PLR values over 10 and NLR values below 0.1 are the gold standard, signaling a test with excellent diagnostic punch.
These metrics aren't just for medicine; they're essential when evaluating predictive analytics software across any industry where accuracy is key.
Getting a firm grasp on these advanced metrics is what separates a good diagnostic tool from a truly exceptional one. This is the kind of deep, practical understanding we build into every custom web DICOM viewer and medical imaging platform here at PYCAD. We invite you to see our expertise in action by visiting our portfolio page: https://pycad.co/portfolio.
Frequently Asked Questions
When you start digging into what is sensitivity and specificity, a few questions always seem to pop up. These metrics aren't just abstract concepts; they are the bedrock of confidence in any diagnostic test. Getting a feel for how they work in the real world can be a game-changer. Let's walk through some of the most common ones.
Which Is More Important Sensitivity or Specificity
This is the big one, and the honest answer is: it depends entirely on what’s at stake. There's no universal "better" metric. The real question you need to ask is, "What's the cost of getting it wrong?"
-
Lean on Sensitivity when a false negative would be disastrous. Think about initial cancer screenings. You absolutely cannot afford to miss a potential case. In this scenario, you'd rather have a few false alarms that can be sorted out later than let a single true case slip through the cracks.
-
Lean on Specificity when a false positive carries a heavy burden. If a positive result triggers invasive surgery, a high-risk treatment, or significant emotional trauma, you need to be incredibly sure it’s the real deal.
Mastering diagnostics is all about understanding this trade-off and choosing the right balance for the specific situation.
Can a Test Have High Sensitivity and High Specificity
Absolutely! In fact, that's the holy grail. The dream for any diagnostic tool is to hit 100% on both—perfectly catching every single person with the condition while also correctly giving the all-clear to everyone who is healthy.
While hitting that perfect 100% is exceptionally rare, it's the benchmark that drives all innovation in this field. The AI models and advanced imaging techniques we see today are all striving to get closer to that ideal. The goal is always to build a tool that's both a brilliant detective and a trustworthy judge, minimizing errors from every angle.
How Does Disease Prevalence Affect These Metrics
This is a really insightful question because it gets to the heart of how we interpret results. Here’s the key takeaway: sensitivity and specificity are inherent to the test itself. They measure how good the tool is, and that doesn't change whether a disease is rare or common.
But—and this is a big but—prevalence has a huge impact on the predictive value of a test's result. Let me explain. If a disease is extremely rare, even a positive result from a very accurate test is more likely to be a false positive. Think about it: there are just so few true cases out there. This is precisely why a single test is never the whole story. Clinicians always have to consider the bigger picture, including how common the disease is, to understand what a result truly means for their patient.
At PYCAD, these are the kinds of challenges we tackle every day. We don’t just build web DICOM viewers; we build custom web DICOM viewers and integrate them into medical imaging web platforms, making sure our tools are perfectly calibrated for the clinical task they're designed for. Our passion is delivering technology that empowers clinicians to make those critical, life-changing decisions with total confidence.
Take a look at what we've been working on in the PYCAD portfolio.

