
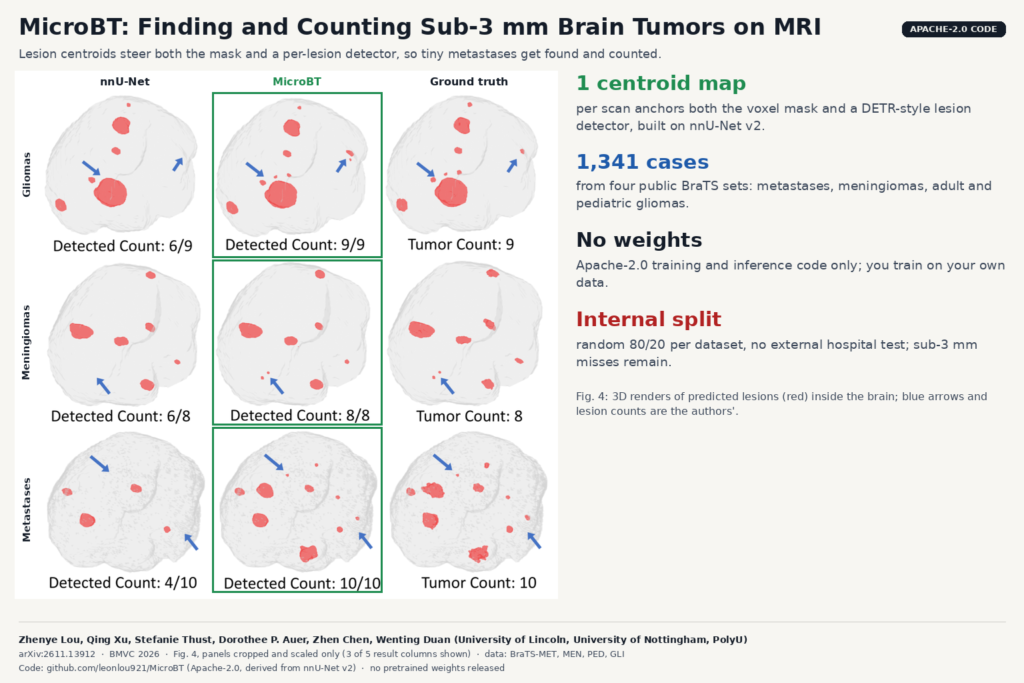
If you have ever reviewed an automatic brain metastasis contour, you know where it goes wrong. The big enhancing lesion is fine. The problem is the 2 mm dot near the cortex that the model never drew, or the two neighbouring foci it merged into one blob. For stereotactic radiosurgery, the lesion count drives the plan, so a missed dot is a missed target. A team from the University of Lincoln, the University of Nottingham and The Hong Kong Polytechnic University built MicroBT around that problem. It segments brain tumors on multi-sequence MRI and, in the same pass, finds and counts each lesion, with special attention to the ones at or under 3 mm. The paper is arXiv:2611.13912, accepted at BMVC 2026, and the code is public under Apache-2.0.
What MicroBT does
The input is the usual four BraTS sequences (T1, T1 with contrast, T2 and FLAIR), co-registered and resampled to 1 mm. The output is three things per scan: a tumor mask, a centroid heatmap, and a list of lesion instances with 3D bounding boxes and scores.
Small lesions vanish in Dice-style training because a lesion of a few voxels contributes almost nothing to the loss next to a large tumor. Every lesion has a centre, whatever its size. So MicroBT first predicts a heatmap of lesion centres from a deep layer of a standard nnU-Net encoder. That heatmap then feeds two branches. In the segmentation branch, it is concatenated into the skip connection, so the decoder gets an explicit hint of where something small might be. In the detection branch, the 50 strongest peaks become starting queries for a DETR-style transformer head that predicts one box and one class per lesion. The authors call this the centroid-anchored synergistic paradigm (CAS).
Two training changes support it. The volume-calibrated loss gives each lesion a box-regression weight between 1 and 2, larger for lesions smaller than the batch average. And training runs in two stages: 300 epochs with plain weights so the encoder learns the anatomy, then 200 epochs with the size weights switched on and the encoder learning rate cut to 1e-6 while the heads keep training.
What they found
The data comes from four public BraTS challenge sets: BraTS-Lighthouse-MET 2025 for metastases, BraTS-MEN 2023 for meningiomas, and BraTS-PED 2024 plus BraTS-GLI 2025 for pediatric and adult gliomas. The authors kept only cases with at least one lesion of 3 mm or less in maximum 3D diameter, 1,341 cases in total, checked by two radiologists. Each dataset was split 80/20 at random into training and test.
They compared against nine segmentation models, including nnU-Net, Swin-UMamba, SegMamba and nnMamba, plus nnDetection as a pure detector. nnU-Net was the strongest baseline for masks, and MicroBT beat it on every tumor type, with the largest gap on metastases (74.68 against 72.15 Dice).
The counting gap is larger. On metastases, the mean absolute percentage error of the per-scan lesion count fell from 0.568 with nnU-Net to 0.423, and AP50 (box precision at 50 percent overlap) rose from 47.51 to 65.96. nnDetection did worst of all at counting, which the authors put down to the extreme size range of brain tumors. On the free-response curves for lesions of 3 mm or less, MicroBT holds about 68 percent sensitivity, where nnU-Net stays under 55 percent.
The figure at the top of this post is the authors’ qualitative example. In the metastasis case, nnU-Net finds 4 of 10 lesions and MicroBT finds all 10. It shows one hand-picked case per tumor type, so the tables above are the evidence.
Why a viewer or clinic team should care
Most segmentation products report lesion counts by running connected components on the mask. That works until two lesions touch or one is too small to survive thresholding. MicroBT outputs instances directly, with a centre and a box per lesion, which maps cleanly onto how a radiologist or a radiosurgery planner works: a numbered list of targets you can step through, each with a location you can jump to in the viewer.
MicroBT is also built on nnU-Net v2. The repository keeps the full nnU-Net source tree (pinned to a commit from June 2025) and adds the MicroBT trainer, loss, inference and evaluation on top. If your team already trains nnU-Net models on NIfTI data, the data layout and preprocessing are familiar. Training ran on a single RTX 3060 in the paper, so this is within reach of a small team.
The heatmap is a useful output on its own. Even if you keep your current segmentation model, a per-scan map of “possible small lesion here” is a reasonable thing to surface as a second-look layer in a reading tool.
What it does not tell you yet
- Small lesions are still missed often. At the case level, among 268 test scans with a lesion of 3 mm or less, MicroBT still missed the small lesions in 94 (35.1 percent), against 117 for nnMamba.
- No external test. Every number comes from a random 80/20 split inside each public dataset. There is no held-out hospital, scanner or protocol, and BraTS data is already skull-stripped and resampled, which a raw clinical DICOM series is not.
- The dataset was filtered to cases that contain micro-lesions. That is fair for the question asked, but it is not the case mix a clinic sees, so false positives on scans without small lesions are not well characterised.
- Gliomas are mixed. For lesions of 3 mm or less in gliomas, MicroBT’s count error (0.959) is slightly worse than nnU-Net’s (0.931). The gains are clearest on metastases.
- The ablation table is hard to reconcile with the main results. The “no components” baseline has the same AP50 as nnU-Net (59.06) but a count error of 2.363 against 0.567 in the main table, and the paper does not explain the difference. Read the per-component gains loosely.
- Paper and code count differently. The paper gets its lesion count from the detection boxes after non-maximum suppression. The repository’s evaluation counts connected components of the final mask and says detection proposals never change that count. If you compare against the paper, know which count you are reporting. The model card itself warns that boxes, heatmap landmarks and the mask count can disagree.
- No runtime or parameter numbers are given in the text, only a bubble chart saying the cost is comparable to other models.
How to try it
The repository leonlou921/MicroBT has the full pipeline: environment check, NIfTI conversion, nnU-Net planning and preprocessing, the two training stages, sliding-window inference, and an evaluation script that reports Dice, HD95, box detection and lesion count per case. It is licensed Apache-2.0, like the nnU-Net code it builds on. There are no pretrained weights. The README and the inference docs say you must train your own model, and the model card states it is a research tool, not validated for diagnosis or treatment decisions.
A practical first test is a few dozen of your own post-contrast metastasis cases with radiologist counts, comparing MicroBT’s instance list against your current nnU-Net plus connected components, split by lesion size. For more brain MRI work on the blog, see MoFD, which synthesises contrast-enhanced brain MRI from T1, T2 and FLAIR, and Random Wavelet nnU-Net for another small-lesion nnU-Net variant.
Source and license
Paper: Zhenye Lou, Qing Xu, Stefanie Thust, Dorothee P. Auer, Zhen Chen and Wenting Duan, “MicroBT: Centroid-Guided Synergistic Learning for Multi-Modal Micro Brain Tumor Segmentation and Counting”, arXiv:2611.13912 (cs.CV, 10 November 2026), accepted at the British Machine Vision Conference (BMVC) 2026. Lou and Xu contributed equally; Zhen Chen is the corresponding author. Affiliations: University of Lincoln (School of Engineering and Physical Science), University of Nottingham (School of Computer Science and Queen’s Medical Centre) and The Hong Kong Polytechnic University. Code: github.com/leonlou921/MicroBT, Apache-2.0, derived from nnU-Net v2, no pretrained weights. Data: public BraTS 2023 to 2025 challenge datasets, each under its own terms. Featured image: Fig. 4 of the paper, three of six columns, panels cropped and scaled.