
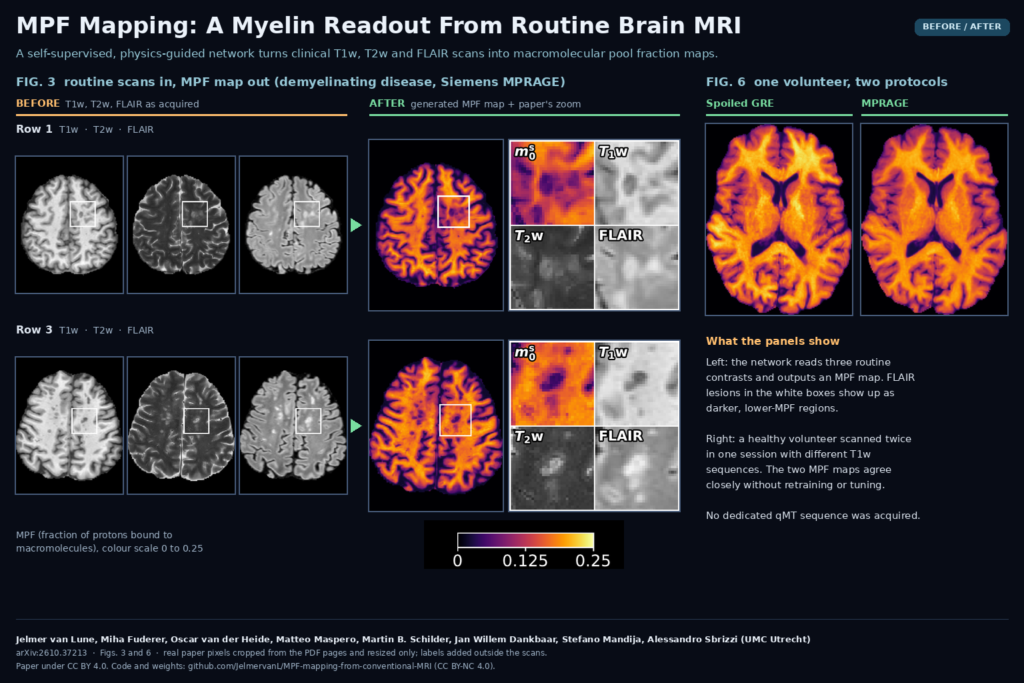
Most brain MRI archives are full of T1-weighted, T2-weighted and FLAIR scans, and almost none of them contain a quantitative myelin measurement. Getting one usually means adding a dedicated quantitative magnetization transfer (qMT) sequence, which costs scan time and only helps for patients scanned after you add it. Jelmer van Lune, Miha Fuderer, Oscar van der Heide, Matteo Maspero, Martin B. Schilder, Jan Willem Dankbaar, Stefano Mandija and Alessandro Sbrizzi at UMC Utrecht estimate the macromolecular pool fraction (MPF), a myelin-sensitive biomarker, straight from those three routine contrasts. The method is described in arXiv:2610.37213, and the PyTorch code and trained weights are on GitHub.
What MPF is, in one paragraph
In a two-pool model of brain tissue, part of the protons sit in free water and part are bound to macromolecules such as proteins and lipids. The bound protons relax far too fast to image directly, but they trade magnetization with the free water and change how fast the visible signal recovers. MPF is the fraction of protons in that bound pool. Myelin carries a lot of it, so MPF is lower where myelin is lost, and post-mortem work has tied reduced MPF to histological demyelination. MS studies use it for exactly that reason.
Why a clinic or viewer team should care
The input is the protocol most sites already run: a 3D T1w (spoiled gradient echo or MPRAGE), an axial 2D T2w turbo spin echo and a 3D FLAIR. The output is an MPF map, plus free-water T1, T2 and proton density maps, for every past and future session that has those scans. For a research archive that means retrospective myelin studies on thousands of patients without recalling anyone. For a viewer or PACS add-on, it is one more parametric overlay you can compute in the background and show next to FLAIR, the way the paper does in Figure 3.
Pipeline builders hit one catch: the physics model needs the acquisition parameters of each scan: TR, TE, TI, flip angle and the sequence-averaged RF power, B1rms. The authors pulled these from DICOM headers for the Utrecht data and from metadata files for the public set. B1rms has its own DICOM attribute (0018,1320), but anonymization tools and NIfTI conversions often drop it, so keep the original headers or a sidecar file.
How the method works
- A 2D U-Net reads all three contrasts. A shared encoder processes T1w, T2w and FLAIR slices separately, attention modules fuse the features at each level, and one decoder outputs four maps: free-water T1, free-water T2, proton density and MPF. The network has 9.06 million trainable parameters and works on 224 x 224 axial slices.
- The scanner settings steer the network. Each contrast comes with a nine-value vector (contrast type, log TR, log TE, sine of the flip angle, B1rms, inversion flag, log TI). A small MLP turns it into an embedding that drives adaptive instance normalization in the encoder, so the same weights read a Philips spoiled GRE and a Siemens MPRAGE differently.
- Training needs no reference maps. The predicted maps go through closed-form Bloch signal equations for each sequence type, with a magnetization transfer term that links apparent T1 to MPF and to the sequence’s RF power. The loss compares the synthesized T1w, T2w and FLAIR images with the acquired ones. Because free-water T1 and MPF can trade off against each other, a prior on white matter T1 and a soft lower bound on proton density keep the solution in a physical range.
Training ran for 20 epochs on 6,084 sessions and took about 12 hours on a single NVIDIA RTX 4500 Ada GPU.
Data
The dataset combines 5,312 sessions from four Philips 3 T systems at UMC Utrecht with 2,393 sessions from a Siemens Magnetom Vida 3 T in the public MR-RATE dataset (Istanbul Medipol University), 7,705 sessions from 4,489 subjects in total. Subjects were split 80/5/15 into training, validation and test, so the test set holds 1,237 sessions. Preprocessing follows a standard neuro pipeline: dcm2niix, resampling to the T2w grid, rigid registration with ANTsPy, HD-BET skull stripping, N4 bias correction and SynthSeg tissue masks.
What the results show
White matter came out higher than gray matter in every vendor and protocol group, which is the expected order. In 70 MR-RATE test sessions with a report-derived demyelinating-disease label, lesions segmented with LST-AI had 35.6% lower MPF than normal-appearing white matter, in the range that dedicated qMT studies report for MS lesions. Four confirmed MS patients from Utrecht showed similar drops.
Archives mix protocols, so the authors tested consistency directly. They scanned one healthy volunteer twice in the same session, once with a spoiled GRE T1w protocol and once with MPRAGE, and the two MPF maps differed by 7.7% on average across brain tissue. Removing the acquisition conditioning roughly doubled that difference, to 15.3%.
Code, weights and license
The repository JelmervanL/MPF-mapping-from-conventional-MRI contains the training and inference code (Hydra configs, TorchIO data loading, the physics module) and a v1.0.0 release with the trained generator weights, a 36 MB latest_net_G.pth. Inputs are preprocessed NIfTI volumes plus one CSV row per session with the sequence parameters. The code and weights are under CC BY-NC 4.0, so commercial use needs a separate agreement with the authors. The paper itself is CC BY 4.0. The Utrecht data cannot be shared, but MR-RATE is available on Hugging Face under its own access terms.
Limits before you put it in front of a radiologist
- Unseen sequence types break it. When the authors withheld spoiled GRE from training, the model put white matter MPF well below the in-domain values on those scans. Do not run the released weights on a T1w sequence family the model never saw without validating first.
- Only 3 T, and a narrow protocol mix. All scans are 3 T, protocol variety is mostly in the T1w, and 3D T2w or 2D FLAIR were not represented.
- No ground-truth qMT comparison. There were no paired qMT scans, so the evaluation rests on plausibility, lesion contrast and reproducibility. Gray matter and white matter are also closer together than in prospective qMT (a GM to WM ratio near 0.79 versus about 0.5).
- Slice-wise and resampled. Everything is registered to the 2D T2w grid with 3 or 4 mm slices, so 3D detail from T1w and FLAIR is lost, and the network does not use neighbouring slices.
- Soft labels. Disease labels come from radiology reports, the cross-protocol test used a single volunteer, and FLAIR lesions are not specific to demyelination.
Where it fits
We see two near-term uses. Research groups with large neuro archives can run it retrospectively to study myelin changes over years of routine follow-up, provided their T1w sequences resemble the training mix. Imaging software teams can treat it as a parametric map service: pull the three series and their headers from PACS, run the preprocessing chain, and push an MPF overlay back as a derived series for research review. The non-commercial license and the protocol limits both point to research use first.
Paper: van Lune J., Fuderer M., van der Heide O., Maspero M., Schilder M. B., Dankbaar J. W., Mandija S., Sbrizzi A. “Retrospective macromolecular pool fraction mapping from conventional clinical MRI: a physics-guided self-supervised deep learning framework.” arXiv:2610.37213, 2026. Featured image: Figures 3 and 6 of the paper (CC BY 4.0), cropped and resized only.