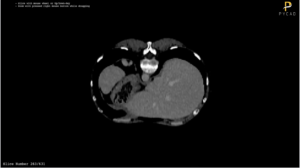
How to use Python, Streamlit, SimpleITK and Nibabel for DICOM/NIFTI Plotting
In our previous blog post, we emphasized the significance of DICOM (Digital Imaging and Communications in Medicine) file formats within the realm of medical imaging. These formats require specialized handling for visualization purposes.
In this post, we won’t revisit the theoretical underpinnings of DICOM files — having already explored that topic extensively in prior discussions. Instead, we’ll dive straight into the practical aspects, focusing on the utilization of Python to develop a straightforward Minimum Viable Product (MVP) for DICOM and NIFTI visualization. This approach aims to provide hands-on insights into working with these crucial medical imaging files.
Requirements
To run the application, you must first ensure that Python is installed on your machine. Afterward, you will need to install several additional dependencies:
pip install streamlit
pip install SimpleITK
pip install nibabel
pip install numpy
pip install matplotlib
Code Explanation
The code is divided into two main sections. The first section concerns the user interface (UI), which encompasses the management of buttons, viewers, and text within the application. The second section pertains to the backend, responsible for processing DICOM or NIFTI files. Let’s explore the key aspects of these code sections in more detail.
Initialize the application
The application can be initialized with st.set_page_config, where we specify the page title, the page icon, and the layout. Note that both the page title and icon are optional.
import streamlit as st

st.set_page_config(page_title='DICOM Viewer', layout="wide", page_icon="assets/logo.ico")

st.image('assets/pycad.png', width=350)
st.title("DICOM Series Viewer")
Handle the uploader
Streamlit’s default file uploader can be utilized to upload DICOM series or NIFTI files. After the upload, it’s essential to check the format of the uploaded file to determine which specific reader should be invoked.
ploaded_files = st.file_uploader("Choose DICOM or NIfTI Files", accept_multiple_files=True, type=["dcm", "nii", "nii.gz"], key="file_uploader")

if uploaded_files:
    with tempfile.TemporaryDirectory() as temp_dir:
        is_nifti = False
        for uploaded_file in uploaded_files:
            bytes_data = uploaded_file.read()
            file_path = os.path.join(temp_dir, uploaded_file.name)
            with open(file_path, 'wb') as f:
                f.write(bytes_data)
            if uploaded_file.name.endswith(('.nii', '.nii.gz')):
                is_nifti = True

        if is_nifti:
            image_np = load_nifti_file(file_path, "nifti_image_data")
        else:
            image_np = load_and_store_dicom_series(temp_dir, "dicom_image_data")
DICOM/NIFTI Reader
As previously noted, the choice of reader depends on the input format, necessitating the use of two distinct readers tailored to the specific file types.
NIFTI Reader
def load_nifti_file(filepath, session_key):
    if session_key not in st.session_state:
        nifti_img = nib.load(filepath)
        image_np = np.asanyarray(nifti_img.dataobj)
        st.session_state[session_key] = image_np
    return st.session_state[session_key]
DICOM Series Reader
def load_and_store_dicom_series(directory, session_key):
    if session_key not in st.session_state:
        reader = sitk.ImageSeriesReader()
        dicom_names = reader.GetGDCMSeriesFileNames(directory)
        reader.SetFileNames(dicom_names)
        image_sitk = reader.Execute()
        image_np = sitk.GetArrayFromImage(image_sitk)
        st.session_state[session_key] = image_np
    return st.session_state[session_key]
Slice Plotter
Given that our aim is to visualize the slices in a 2D format, it’s necessary to develop a plotter capable of handling slices in any orientation — be it axial, coronal, or sagittal. When dealing with NIFTI inputs, a 90° rotation may be required. This step is essential because some libraries, by default, alter the orientation of the 3D numpy array.
def plot_slice(slice, size=(4, 4), is_nifti=False):
    # Adjust the figure size for consistent viewer sizes
    fig, ax = plt.subplots(figsize=size)
    # Calculate the square canvas size
    canvas_size = max(slice.shape)
    canvas = np.full((canvas_size, canvas_size), fill_value=slice.min(), dtype=slice.dtype)
    # Center the image within the canvas
    x_offset = (canvas_size - slice.shape[0]) // 2
    y_offset = (canvas_size - slice.shape[1]) // 2
    canvas[x_offset:x_offset+slice.shape[0], y_offset:y_offset+slice.shape[1]] = slice
    fig.patch.set_facecolor('black')  # Set the figure background to black
    ax.set_facecolor('black')
    if is_nifti:
        canvas = np.rot90(canvas)
    else:
        canvas = canvas[::-1, ::-1]

    ax.imshow(canvas, cmap='gray')
    ax.axis('off')
    return fig
The plot_slice function can be invoked as needed by simply providing the 2D slice in the desired orientation.
axial_slice_num = st.slider(' ', 0, image_np.shape[2] - 1, 0, key="axial_slider")
fig = plot_slice(image_np[:, :, axial_slice_num], size=(3, 3), is_nifti=is_nifti)
st.pyplot(fig, clear_figure=True)
Run the application
Building and running the application is not a complex process. You can launch the application with the following command:
streamlit run fancy_viewer.py # the name of your main scriptRelated Blogs
- Dicom Anonymization Using Python
- Dicom Mri Windowing
- Convert a Nifti File into Dicom Series Using Python
- Convert a Dicom Series into one Nifti File
- What is the difference between Dicom and Nifti images?
Full Code
You can download the whole code from our shared GitHub repository here.


