
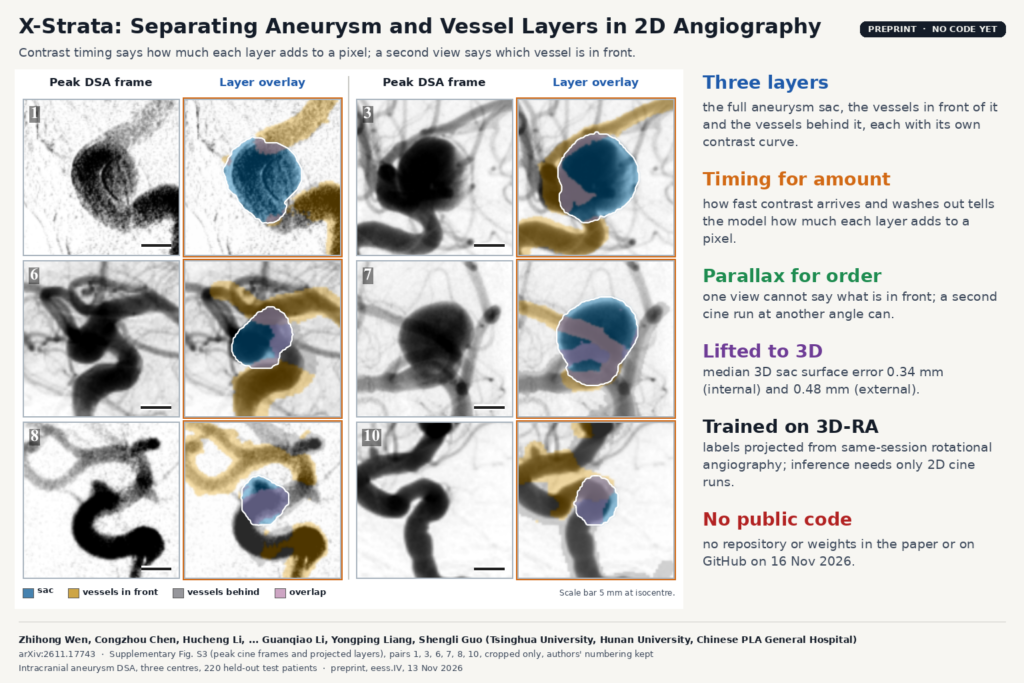
On a cerebral angiogram, an intracranial aneurysm sits on its parent artery and the branches around it often run straight across the sac in projection. A digital subtraction angiography (DSA) pixel adds up all the contrast along its ray, so the sac and the vessels crossing it end up as one dark blob. Part of the sac edge disappears, and the time-density curve you measure inside the sac is mixed with vessel signal. 3D rotational angiography (3D-RA) resolves the overlap, but not every patient gets a 3D run. X-Strata, from Tsinghua University, Hunan University and three neurosurgery departments of the Chinese PLA hospitals in Beijing, tries to pull the layers apart from routine 2D cine runs. It is described in arXiv:2611.17743 (eess.IV, 13 November 2026).
What X-Strata does
X-Strata takes one or two cine DSA runs and their C-arm geometry and splits each run into three layers: the complete (amodal) aneurysm sac, the vessels in front of the sac and the vessels behind it. Each layer gets a path-length map, which says how much contrast-filled tissue that layer puts on each pixel, and its own contrast curve over time. The layers are then lifted into a shared 3D representation, so with two runs you also get a 3D sac surface.
The authors use each cue for one job. Contrast timing tells the model how much each layer contributes to a pixel, because contrast reaches the sac and the vessels at different moments and washes out at different rates. Parallax between two views tells it which vessel lies in front, because a single view cannot. The paper proves the second point. If you swap two structures along a ray and keep their path lengths and curves, the projected cine does not change, so a one-view model can only guess the order.
How it works
- Encoding (first pass). Each cine frame goes through a DINOv2 ViT-B/14 encoder with LoRA. Every 14 by 14 patch gets a time embedding and a ray embedding built from the DICOM projection geometry, so the network knows where the patch sits along the X-ray beam. Attention is split into a kinetic stream that compares frames within one injection and a geometry stream that exchanges information across runs, so a different bolus timing in the second run is not mistaken for a correspondence.
- Contrast curves. A purity head finds pixels that belong to only one layer and uses them to start each layer’s curve, an idea taken from separable non-negative matrix factorisation. The model then alternates path-length and curve updates for a fixed number of unrolled non-negative least-squares steps. Each curve is a sum of gamma variates with a shift, which allows sub-frame delays.
- Vessel depth. From the first-pass maps the model extracts vessel centerlines and searches signed depths for each centerline node in the second view. A plane-level “moment anchor”, computed from the centroids of the sac and vessel layers in both views, keeps the search near a plausible depth, and a forward-backward pass along each vessel smooths the result. Each vessel pixel ends up with a probability of being in front.
- Hidden sac edge. The covered part of the sac has no boundary to see, so X-Strata fits a star-shaped contour to the visible rim and ignores rim points hidden by vessels. With two runs, a low-order spherical-harmonic surface fitted to both rims starts the 3D sac.
- Fusion and rendering (second pass). The second pass weights appearance, timing, parallax and shape by how reliable each cue is for that case: timing counts for more when the sac and vessel curves differ, parallax when the views are far apart, shape when more of the rim is exposed. The layers are rendered as 3D Gaussians that can be projected into another view.
Training labels come from same-session 3D-RA. The authors segment the sac and vessels in the 3D volume, register it to each cine run by refining a six-degree-of-freedom pose, and project it to get layer masks, path lengths and signed depth. Labels with poor registration get less weight, and procedures where two sac segmentations disagree (3D Dice below 0.85) are dropped. At inference the model needs only the 2D cine runs and their geometry.
What they tested it on
The data come from a DSA cohort of 1,982 patients at three centres. After excluding patients without same-session 3D-RA, without an eligible pre-treatment run, with failed labels or poor images, 610 patients and 1,701 cine runs remained. Centres A and B gave 342 training, 48 validation and 98 internal test patients; centre C gave 122 external test patients in 346 runs. Many in the wider cohort were treated with flow diverters or intrasaccular devices, and the anchor run is always a pre-deployment treatment run.
The key score is overlap-region sac Dice (O-Dice), which only counts the area where vessels cross the sac, plus balanced depth-order accuracy for front and behind vessels. With two runs, X-Strata ranked first among 14 two-view baselines, including VGGT and the sparse-view reconstruction methods DIF-Net and C2RV, with O-Dice of 0.693 internally and 0.641 externally. Against projected C2RV, the strongest sac baseline, the paired gain was 1.45 and 1.11 points and both confidence intervals included zero, so on sac shape the two are close.
The second view matters most for depth order. Every one-run method stayed between 0.49 and 0.53 balanced accuracy, close to chance, as the theory predicts. Two-run X-Strata reached 0.703 internally and 0.659 externally, and 0.75 and 0.71 when the two views were at wide angles. The 3D sac surfaces had a median Chamfer distance of 0.34 mm internally and 0.48 mm externally.
The featured image is supplementary Fig. S3 of the paper: peak cine frames next to their layer overlays, with the sac in blue, front vessels in gold, behind vessels in gray and overlap in pink. The caption calls them “projected layers” and does not say whether they are model output or the projected 3D-RA reference, so read them as examples of the target output.
What it would add to an angiography viewer
For a neuro-interventional viewer, each output maps onto something a team already does by hand. The sac layer gives a full outline even where a branch crosses it, which could help with neck and dome measurements on 2D runs. A front-or-behind label on each crossing vessel can be drawn as a coloured overlay on the cine, with the model’s probability as a confidence shade. The sac’s own contrast curve, without vessel signal mixed in, is what parametric maps and washout measures should be computed from. With two runs, the 3D sac surface can be shown next to the 2D frames.
The paper also gives a rule for choosing runs. Order accuracy rose by about 20 points from the narrowest to the widest view separation in both cohorts, so a viewer could pick the pair of runs with the largest angle between them, or warn when the only available pair is nearly parallel.
The order probabilities are reasonably calibrated: mean expected calibration error on overlap pixels was 0.030 internally. A viewer can show them as a confidence value instead of a hard label.
What it does not tell you yet
- Every evaluated patient had 3D-RA, because scoring needs it. The use case the authors aim for, patients who only get 2D angiography, has not been tested directly.
- Centre C, the external site, uses the same scanner vendor as A and B. Other vendors, frame rates and injection protocols could change the timing and centerline cues the model depends on.
- With two runs, depth order is still wrong for roughly 30% of overlap pixels (balanced), and near chance with one run or with nearly parallel views. A vessel running close to the sac can give almost the same position in both views for either sign.
- Misregistration, mask truncation, magnification changes or patient movement between runs break the parallel-projection assumptions behind the moment anchor.
- Two rims can fit more than one 3D surface. Median sac-volume error was 17.21% internally and 25.81% externally, and the authors note local errors at the neck and boundary even when volume agrees.
- The kinetic results come from controlled mixtures of sac and vessel curves, and the link between recovered curves and clinical grades of residual filling after treatment has not been studied.
- The paper has no reader study and no clinical outcome.
How to try it
The paper gives no code or weights link, and a GitHub search on 16 November 2026 found no X-Strata repository from the authors, so there is nothing to run yet. The data are retrospective clinical angiograms from the three hospitals, approved by their review boards, and are not public. The method section describes the 3D-RA label projection and the two-view centerline depth search in enough detail to rebuild them. On the blog, see also TDBM vessel maps from X-ray coronary angiography and self-training coronary vessel masks with pre-contrast frames.
Source and license
Paper: Zhihong Wen, Congzhou Chen, Hucheng Li, Xun Han, Jianning Zhang, Yakun Chen, Hao Gao, Hao Zhao, Yudong Ma, Guanqiao Li, Yongping Liang and Shengli Guo, “X-Strata: Separating Aneurysms and Overlapping Vessels into Layers from 2D X-ray Angiography”, arXiv:2611.17743 (eess.IV, 13 November 2026), preprint, 22 pages including 10 pages of supplementary material. Affiliations: Vanke School of Public Health, Tsinghua University; College of Computer Science and Electronic Engineering, Hunan University; Departments of Neurosurgery, First and Sixth Medical Centers of the Chinese PLA General Hospital; Department of Neurosurgery, Air Force Medical Center of the Chinese PLA (co-corresponding authors Guanqiao Li, Yongping Liang and Shengli Guo). Code and weights: not released, licence not stated. Data: retrospective DSA and 3D-RA from three centres, not public. Featured image: supplementary Fig. S3 of the paper, six of twelve pairs, cropped only.