
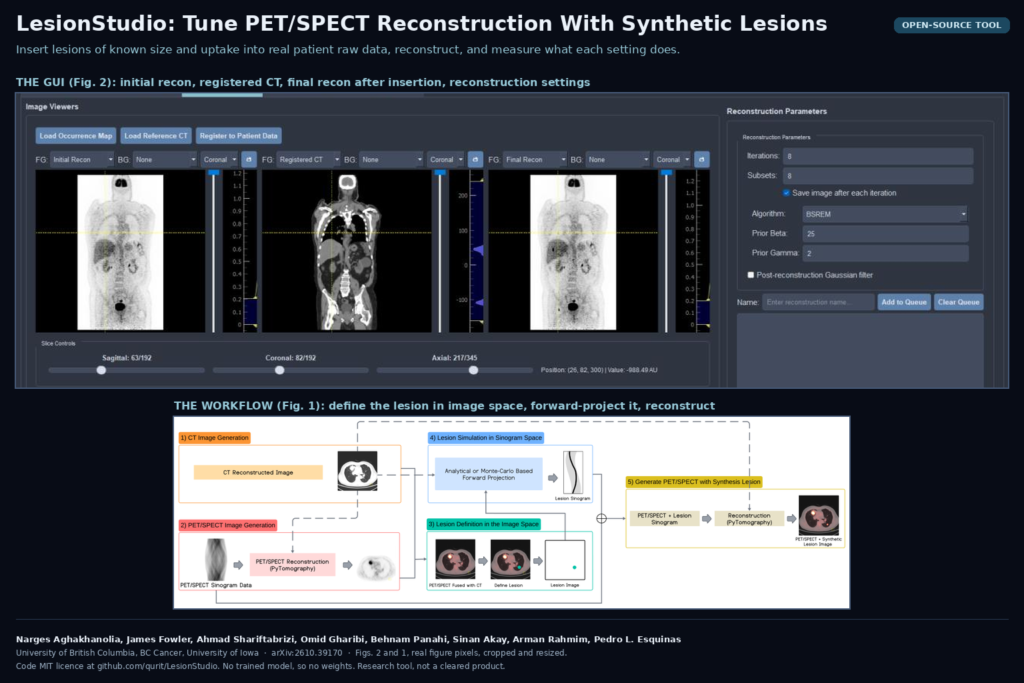
Every PET department picks its reconstruction settings at some point: OSEM or a regularized algorithm, how many iterations, how much smoothing. Most of the time that choice is checked on a phantom, a plastic body with fillable spheres. Spheres in water behave nothing like a lymphoma node next to the liver, and nobody knows the true uptake of a real patient’s lesion, so the phantom gets the vote by default. In arXiv:2610.39170, Narges Aghakhanolia, James Fowler, Ahmad Shariftabrizi, Omid Gharibi, Behnam Panahi, Sinan Akay, Arman Rahmim and Pedro L. Esquinas (University of British Columbia, BC Cancer and the University of Iowa) release LesionStudio, an open-source tool that puts lesions with known size and uptake into real patient PET and SPECT acquisitions, then reconstructs them so you can measure what each setting does to them.
There is no neural network in this one. It is a ground-truth factory, and that is why I think it belongs on a blog about imaging software. Whether you are tuning a scanner protocol, checking an AI denoiser, or testing a lesion segmentation model, you need cases where you know the right answer, and real patients never come with one.
What the tool does
LesionStudio is a Python desktop application with a PyQt interface, built on the PyTomography reconstruction library from the same group (Qurit lab at BC Cancer). The workflow runs in four tabs.
- Setup. Load the raw data. For PET that means the list-mode file and the scanner’s correction files; for SPECT it means the DICOM projections plus a CT for attenuation.
- Reconstruction. Run a first reconstruction to get the image grid and look at the anatomy, with the CT resampled underneath.
- Lesion insertion. Click a spot on the axial, coronal or sagittal view and drop a lesion there. It can be a sphere with a chosen radius and intensity, or a real lesion shape taken from a library of segmented patient lesions, rescaled to the size and uptake you want.
- Re-reconstruction and analysis. The lesion is forward-projected into the raw data, the combined data are reconstructed with each setting you queued, and the analysis tab compares every result with the known lesion.
The forward projection is what makes this better than pasting a bright blob onto an image. For PET the lesion goes through a time-of-flight system model with resolution modelling and is merged with the measured list-mode events, using the scanner’s own attenuation, normalization, randoms and scatter corrections. So the inserted lesion picks up the same blur, noise and partial-volume loss as a real one.
One detail I liked is what the authors call stochastic background ablation. If you add a lesion on top of the liver, you get liver uptake plus lesion uptake, which is not how tissue works. LesionStudio first removes a matching share of the counts that the background contributed at that spot, event by event in PET list-mode and bin by bin in SPECT projections, then adds the lesion. The lesion replaces the tissue instead of sitting on top of it, and the count statistics stay consistent with the real acquisition.
The reconstruction queue covers OSEM and BSREM for PET, and OSEM, OSMAPOSL, BSREM and KEM for SPECT, with control over iterations, subsets and the penalty strength. You can save the image after every iteration to watch convergence.
What it hangs on a scan
The output is a reconstructed PET or SPECT series with one or more lesions in it, plus the lesion mask and its true activity. Nothing in it is predicted. Each lesion is known down to the voxel, and the tool reports recovery coefficient, bias, background noise, contrast-to-noise ratio, edge overshoot and a feature stability score for SUVmax, SUV90 and entropy.
For a team building PET software, I see three uses. You can show a nuclear medicine department, with its own patients and its own scanner, which reconstruction setting keeps small lesions measurable. You can check an AI denoiser or enhancement step against known lesion uptake, which the authors name as an application. And you can build test sets for a lesion segmentation or SUV measurement tool, where the “ground truth” is the inserted mask and not one reader’s contour. If you already run imaging QA on phantoms, this is the patient-data version of the same job.
Results that matter
The study used FDG PET from patients with diffuse large B-cell lymphoma on a GE Discovery MI scanner. First, realism. The authors inserted 30 lesions from their library into the scans of eight patients, and an experienced nuclear medicine physician read the images without knowing which lesions were inserted. The physician found 26 of the 30 inserted lesions and 29 native ones, and scored how likely each was to be synthetic. Telling the two apart came out at an AUC of 0.49, which is chance.
Then the protocol questions. The authors set a limit of quantification as the smallest lesion whose mean uptake comes back within 25% of the truth. With OSEM at 4 iterations, a common clinical setting, real-shaped lesions met that bar from about 3.7 mL upward. At 10 iterations the limit dropped to about 2.0 mL, but noise and edge overshoot rose with it, and the overshoot inflates SUVmax, the number Deauville scoring leans on in lymphoma. BSREM with a weak penalty reached the same 2.0 mL limit while keeping those edge artifacts in check. Stronger penalties pushed the limit toward larger lesions.
Two smaller findings are worth knowing. Real lesion shapes recovered less uptake than spheres of the same volume, so phantom spheres make a protocol look better than it is on irregular disease. And at a lesion to background ratio of 2:1, no inserted lesion reached the detection threshold under any setting, whatever the algorithm or filter.
The authors conclude that no single protocol suits every task. OSEM needs few iterations for detection and more for mean SUV; weakly regularized BSREM gets close to both at one setting. Which answer applies depends on the clinical task, and the tool lets each site work that out on its own data.
A short SPECT case study on one Lu-177 PSMA therapy patient sits in the supplement. It shows the same pipeline running on SPECT, with spheres inserted in bone, lung and abdomen.
Where it falls short
- PET input is GE list-mode only. The PET path reads GE Discovery MI list-mode and the correction files produced by GE’s lmDuetto toolkit. If your scanners are Siemens, Philips or United Imaging, the PET side does not run as released. SPECT reads DICOM projections and is more portable.
- One scanner, one reader. All PET experiments come from one scanner model, and realism was judged by one physician. The authors say this themselves.
- The public library is smaller than the paper’s. The paper describes 1,579 segmented FDG lymphoma lesions. The library file in the GitHub repository held 90 lesion templates when I checked (47 liver, 15 lung, 15 bone, 13 soft tissue), and the sample PET and SPECT data are listed as coming to Zenodo, with the link still a placeholder in the README.
- Hardware and platform. The README asks for an NVIDIA GPU with CUDA 12.4 and says it was tested on Windows with Anaconda. It is a desktop research tool, not a server you can call from a PACS.
- Settings are site-specific by design. The recommended operating points (OSEM at 4 or 10 iterations, BSREM with a weak penalty) hold for this scanner, tracer and disease. Copying them to another site skips the point of the tool.
- SPECT is a single case. The SPECT evidence is one patient with spheres. A multi-patient SPECT study is listed as future work.
Code, data and licence
The code is public at github.com/qurit/LesionStudio under the MIT licence, with the lesion library as a JSON file in the repository. There are no model weights because there is no trained model. The preprint was posted to arXiv on 29 October 2026 under arXiv’s standard non-exclusive licence. The work was funded by a CIHR project grant and the BC Cancer Foundation. Arman Rahmim declares he is a co-founder of Ascinta Technologies and Pedro L. Esquinas is an employee there. This is a research tool, not a cleared medical device.
If you follow PET reconstruction on the AI side, our post on low-count total-body PET reconstruction is the kind of method a tool like this could test against known lesions.
My take
Most papers we cover give you a model scored against someone’s contours. LesionStudio gives you lesions whose true size and uptake you set yourself, inside real patient data. The GE-only PET input is the real barrier, and porting the list-mode reader to other vendors would be most of the work for anyone outside GE sites. If I were validating a PET denoiser or an SUV tool for a customer, I would still start here: insert lesions of the sizes they care about into their own scans, run the settings they use, and show them the recovery numbers before anyone argues about which image looks nicer.