
Long axial field-of-view PET scanners cover most of the body in one bed position, and sites can spend the extra sensitivity on a lower injected dose or a shorter scan. Fewer counts mean noisier images, and the usual fixes are more smoothing or a vendor denoiser. Movindu Dassanayake, George Webber, Denis Prokopenko, Julia A. Schnabel and Andrew J. Reader from King’s College London and the Technical University of Munich posted arXiv:2610.23870, a paper accepted at the RIME workshop at MICCAI 2026, with a method they call TB-PET-DDS. It plugs a CT-conditioned diffusion model into a list-mode PET reconstruction, so the learned prior removes noise while a PET data step keeps the image tied to the counts the scanner recorded. It is a proof of concept on one patient, and the authors are upfront about it.
Why a PET/CT platform team should care
Most AI denoising for low-count PET runs as image-to-image post-processing on the reconstructed series. A network that only sees the noisy image can invent or erase small uptake, and nothing checks its output against the raw data. Reconstruction-side methods put the scanner’s measurement model back in the loop. For a team running a PET/CT viewer or a nuclear medicine platform, a post-processing filter attaches to a finished series, while a reconstruction step needs list-mode access, scanner geometry and its own validation. Total-body systems such as the Siemens Biograph Vision Quadra (106 cm axial field of view) also make the problem much bigger, with 440 x 440 x 345 voxel volumes and huge list-mode files, and it was an open question whether diffusion priors with a real PET data model can run at that size.
What goes in and what comes out
The inputs are the patient’s CT, a low-count PET image, and list-mode data with the line of response and time-of-flight bin of each event. The output is a reconstructed PET volume on the vendor grid, here 1.65 x 1.65 x 3.0 mm voxels. In the paper the low-count data were made by keeping a random 10% of the events from a 420 s [18F]FDG scan, and the full-count vendor reconstruction from the same scan served as the reference.
How it works
There are two parts. The first is a score-based diffusion model, a U-Net with about 40 million parameters, trained to generate a transverse PET slice from noise given the matching CT slice. It was trained on 48 FDG studies from 47 subjects, about 19,000 slices. Because of compute limits it works slice by slice.
The second part is the PET data model. The authors did not have the vendor’s full reconstruction model in a usable form, so they used a synthesised acquisition. They took the low-dose vendor reconstruction, projected it through a system matrix built from the acquired lines of response and time-of-flight bins (with the open-source ParallelProj projector), and treated those projections as the measured data. Scatter, randoms, attenuation and normalisation are not modelled separately; they come along inside the vendor-corrected image.
Reconstruction runs the diffusion sampler for 100 DDIM steps. At each step the model predicts every slice from the current noisy volume and the CT, the slices are stacked into a 3D anchor image, and a fixed number of list-mode EM iterations pull that anchor toward the PET data. The pull uses a closed-form MAP-EM update with a quadratic penalty, where one weight sets how far the result may stray from the generative anchor. The fused volume then feeds the next diffusion step. Because the EM step is fully 3D, it ties neighbouring slices together, which the slice-wise prior on its own does not.
What the evaluation shows
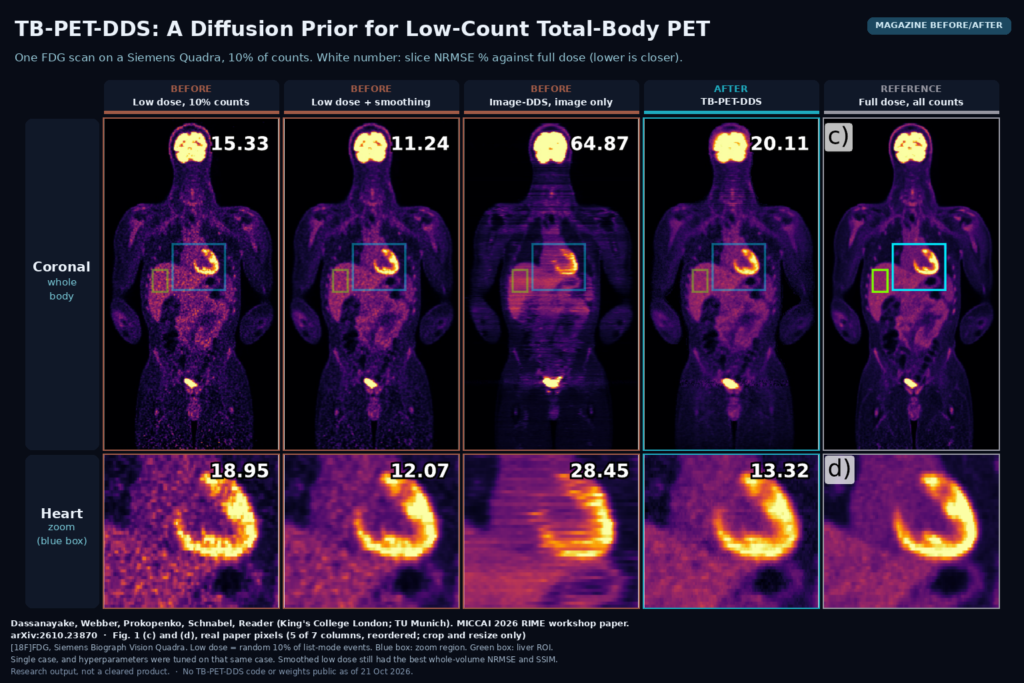
The comparison is against the low-dose vendor image, list-mode MLEM on the synthetic data, the low-dose image with Gaussian post-smoothing (smoothing width tuned for the best score against full dose), the diffusion model with CT only, and Image-DDS, which conditions the diffusion model on the low-dose image instead of the PET data. On whole-volume error against the full-dose image, TB-PET-DDS was far better than the other generative options but behind the plain baselines: NRMSE of 27.93% against 16.32% for the low-dose vendor image and 12.08% for smoothed low dose. It did give the most uniform liver of all methods, which the authors note could also come from extra smoothing. Reconstruction took about 101 minutes with 16 GB peak memory, against about 10 minutes for synthetic MLEM.
The figure
The featured image uses Fig. 1(c) and (d), the coronal view and a zoom on the heart, for five of the paper’s seven columns. The white number in each tile is that slice’s NRMSE against full dose. In the Image-DDS column the slice-wise prior leaves horizontal banding through the whole body, and the heart wall breaks into stripes. TB-PET-DDS removes most of that banding and gives a clean, low-noise myocardium, with a zoom NRMSE of 13.32% against 18.95% for the raw low-dose image. On the full coronal slice it scores 20.11%, worse than both low-dose images, and smoothed low dose still looks closest to the reference in places. This is the one case in the paper, chosen by the authors.
Limits
Everything rests on one clinical scan, and the hyperparameters (number of diffusion steps, EM iterations and fusion weight) were tuned on that same case against its full-dose image, so the numbers are not a held-out validation. The “measured” data are synthetic projections of the low-dose vendor image, not the scanner’s raw list-mode data with real physics. The prior is 2D, and the authors still see some slice inconsistency. No lesion detectability, SUV accuracy or reader study was done, and liver CoV alone cannot tell you whether small lesions survive. PET-DDS with likelihood-gradient steps, the method this one adapts, was not compared directly. At 101 minutes per scan it is far from clinical throughput.
Code, data and license
As of 21 October 2026 there is no public TB-PET-DDS code or trained model, and the paper does not promise a release. The clinical data came through a TOTEM data request at Guy’s and St Thomas’ NHS Foundation Trust and are not public. Two building blocks are open. ParallelProj, the projector library, is on GitHub under Apache 2.0, and the PET-DDS code from Singh et al. that the method adapts is on GitHub too, but its repository shows no license file, so ask the authors before reusing it in a product.
How we would use it
We would not ship this yet. If we added AI denoising to a PET/CT platform for low-count total-body PET, we would keep the measurement model in the loop where the vendor allows it, and write every output as a derived series with a new Series Instance UID, Image Type DERIVED\SECONDARY, a series description that names the method and the count fraction. The original reconstruction stays the primary series. SUV measurement tools in the viewer should read from the original unless the derived series has been validated for quantitation. For a research pilot, the setup in this paper is easy to copy on any total-body site: subsample list-mode events from full-count scans, reconstruct, and compare against the full-count image on lesion detectability and SUVmax as well as NRMSE. For background, see what a DICOM viewer does, our post on slice-aware restoration with ContiLNN, and our post on follow-up PET/CT registration.
Sources
- Dassanayake, M., Webber, G., Prokopenko, D., Schnabel, J. A., Reader, A. J. Generative Priors for Total-Body PET Reconstruction. arXiv:2610.23870, 2026. https://arxiv.org/abs/2610.23870. PDF: https://arxiv.org/pdf/2610.23870.
- King’s College London research portal entry (RIME workshop, MICCAI 2026): kclpure.kcl.ac.uk.
- ParallelProj projector library (Apache 2.0): https://github.com/KUL-recon-lab/parallelproj.
- PET-DDS code, Singh et al.: https://github.com/Imraj-Singh/Score-Based-Generative-Models-for-PET-Image-Reconstruction.
- Featured image: Fig. 1(c) and (d) of arXiv:2610.23870, real paper pixels, five of seven columns, cropped, reordered and resized only.