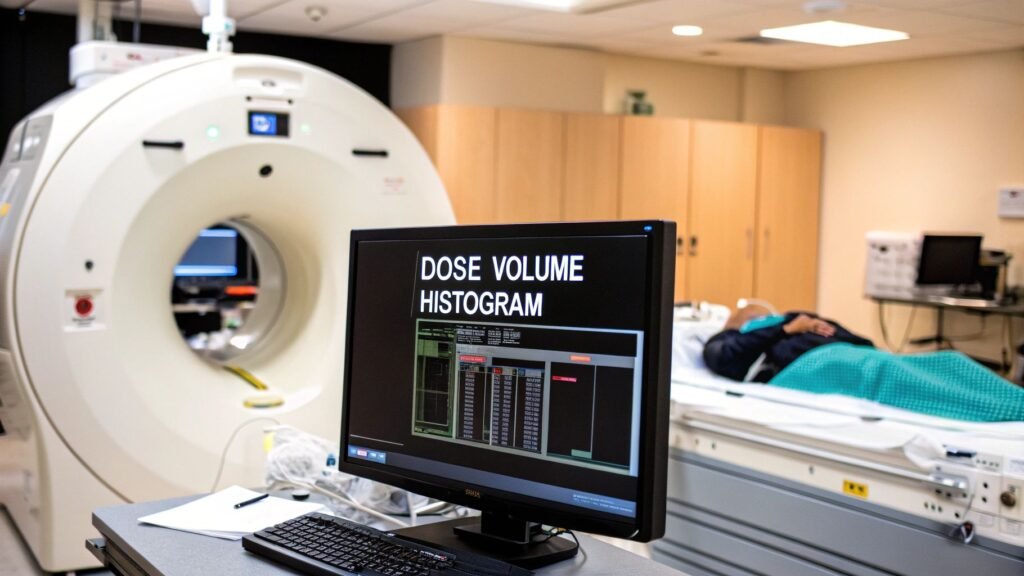
A Dose Volume Histogram, or DVH, is one of the most powerful tools in a radiation oncologist's arsenal. Think of it as a translator. It takes an incredibly complex, three-dimensional map of radiation dose and simplifies it into a clear, two-dimensional graph. This graph shows us exactly how radiation is spread across the tumor and, just as importantly, the healthy tissues nearby.
The Blueprint for Precise Cancer Treatment
Picture a sculptor, chisel in hand, carefully shaping a block of marble. Their goal is to carve away the excess stone to reveal the art within, all without damaging the final, delicate form. Radiation therapy is a lot like that. We're aiming a powerful, tumor-killing dose of energy while meticulously protecting the healthy, life-sustaining organs that live right next door.
The dose volume histogram is the blueprint that guides our hand.
This simple graph gives us a clear, at-a-glance summary of a treatment plan's quality. It boils everything down to two fundamental questions that drive every single radiation plan:
- Is the tumor getting enough radiation to be destroyed?
- Are the healthy organs being spared enough to stay safe?
The Birth of a Foundational Tool
It’s hard to imagine modern radiotherapy without the DVH, but before it existed, judging a treatment plan was a real challenge. Clinicians had to painstakingly scroll through dozens, sometimes hundreds, of 2D image slices and try to mentally stitch together a 3D picture of the radiation dose. It was an art, but it was also imprecise and incredibly time-consuming.
Everything changed in 1979 when Michael Goitein and Verhey introduced the concept of the dose volume histogram. For the first time, there was a way to distill all that complex 3D dose information into one straightforward graph. You can find more details on the history of the DVH on Wikipedia.
This wasn't just a minor improvement; it became the cornerstone of modern treatment planning. It gave us a way to systematically and quantitatively compare different approaches, providing the data we needed to push tumor doses higher while keeping patients safer. That delicate balance is still at the very heart of what we do today. Of course, all of this starts with the foundational process of acquiring medical images.
Here at PYCAD, we at PYCAD, build custom web DICOM viewers and integrate them into medical imaging web platforms, empowering professionals to interact with the complex data sets that form the basis of every dose volume histogram. You can see examples of what we build on our portfolio page.
How To Read a Dose Volume Histogram
At first glance, a Dose Volume Histogram can seem like a jumble of tangled lines. But once you know what to look for, it tells a clear, powerful story about a treatment plan. Think of it as a report card—it grades how well we’ve targeted the tumor while protecting the patient.
The whole graph is built on two simple axes. The horizontal x-axis lays out the dose of radiation, typically measured in Gray (Gy). As you move from left to right, the dose gets higher. The vertical y-axis shows the percentage of an organ's volume.
So, any point on a curve answers a simple question: "What percentage of this organ is getting at least this much radiation?"
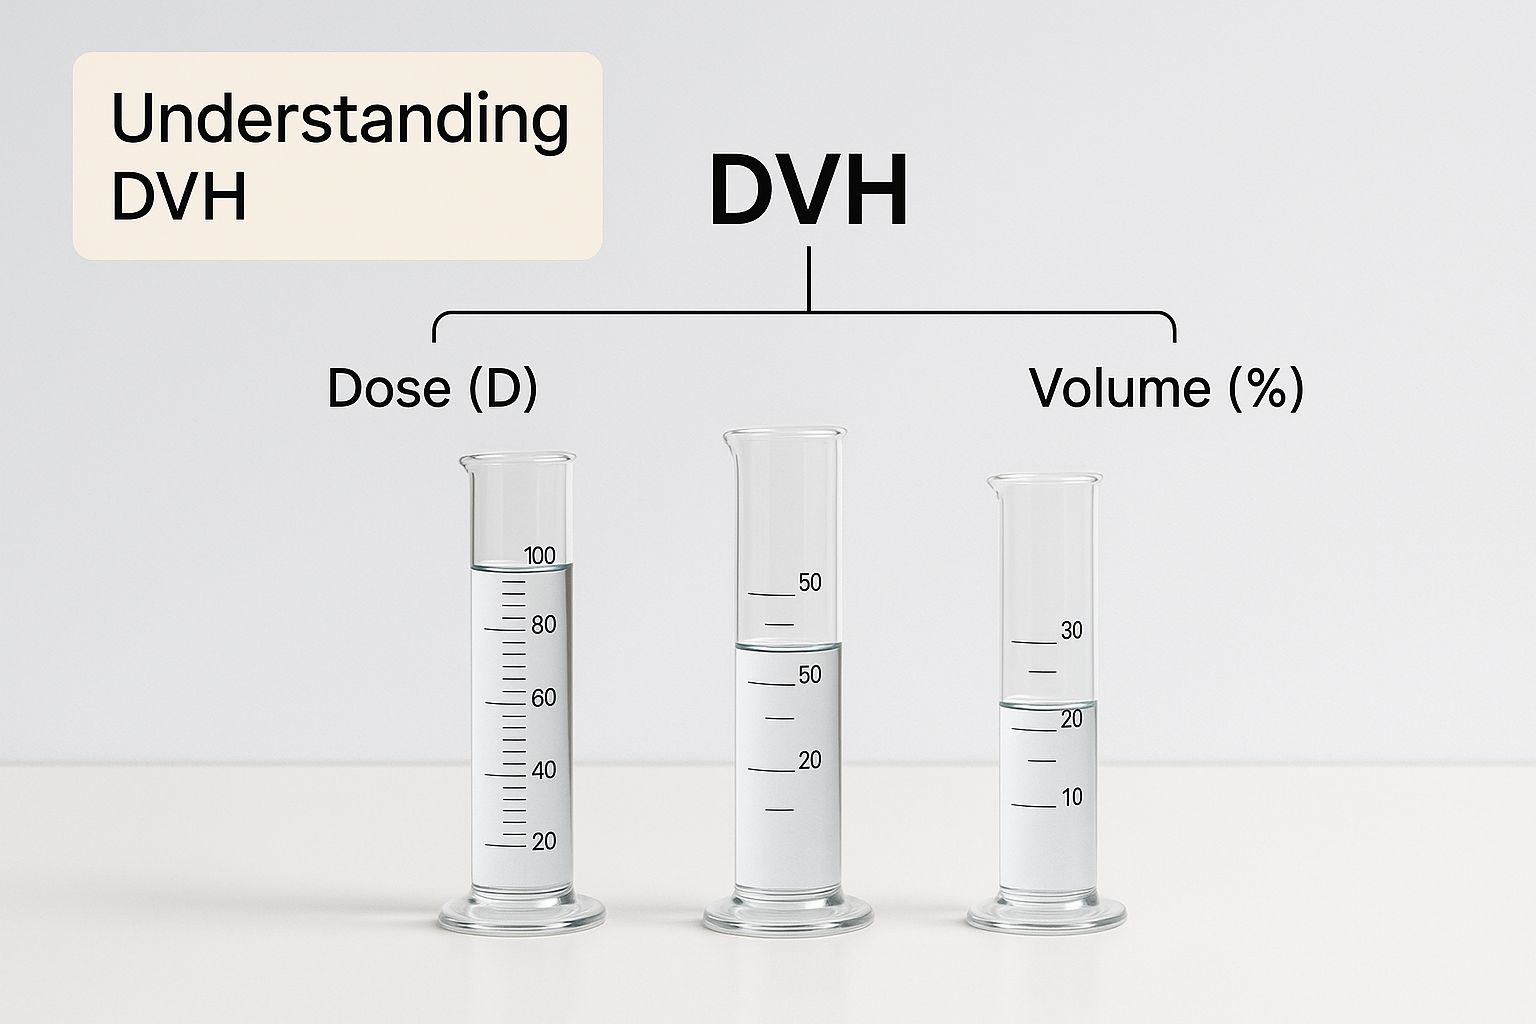
This visual captures the concept perfectly. Each structure—like each container—receives a different amount of dose, and the DVH is our tool for measuring it all with incredible precision.
The Story in the Curves
On any DVH chart, you'll see two main types of curves: one for the tumor itself and several for the nearby healthy organs, which we call Organs at Risk (OARs). The shape of these curves tells you everything.
For the Tumor (Target Volume): You want to see a steep curve pushed far to the right. A sheer, almost vertical line shows that nearly 100% of the tumor volume is getting hit with the high, prescribed dose. That’s the sign of a successful, uniform dose where it matters most. You can learn more about how we define this area in our guide on how to calculate tumor volume.
For Healthy Organs (OARs): Here, the goal is the complete opposite. The ideal curve is low and flat, hugging the bottom-left corner. This shape means a tiny percentage of the healthy organ is receiving any significant dose at all, showing it has been successfully spared.
You can spot a great treatment plan on a DVH instantly. It shows a high, uniform dose blanketing the tumor, while the dose to surrounding tissues drops off a cliff. That’s how we protect a patient's future quality of life.
Key DVH Metrics and Their Meanings
To make sense of these curves, we rely on a few key metrics. These data points help us quantify the plan's quality and ensure it meets established safety standards.
| Metric | What It Measures | Clinical Goal |
|---|---|---|
| D95 | The minimum dose received by 95% of the target volume. | A high D95 ensures comprehensive tumor coverage. |
| V20 (e.g., Lung) | The percentage of the lung volume receiving 20 Gy or more. | Keeping V20 below a certain threshold reduces the risk of radiation pneumonitis. |
| Dmax (Maximum Dose) | The absolute highest dose point within a specific volume. | Limiting Dmax in critical structures like the spinal cord prevents severe toxicity. |
| Dmean (Mean Dose) | The average dose delivered across the entire organ volume. | Monitoring the mean dose is crucial for organs where overall exposure relates to function. |
These metrics aren't just numbers; they are direct indicators of how a patient might fare during and after treatment. They give us the confidence to move forward with a plan that is both aggressive against the cancer and gentle on the body.
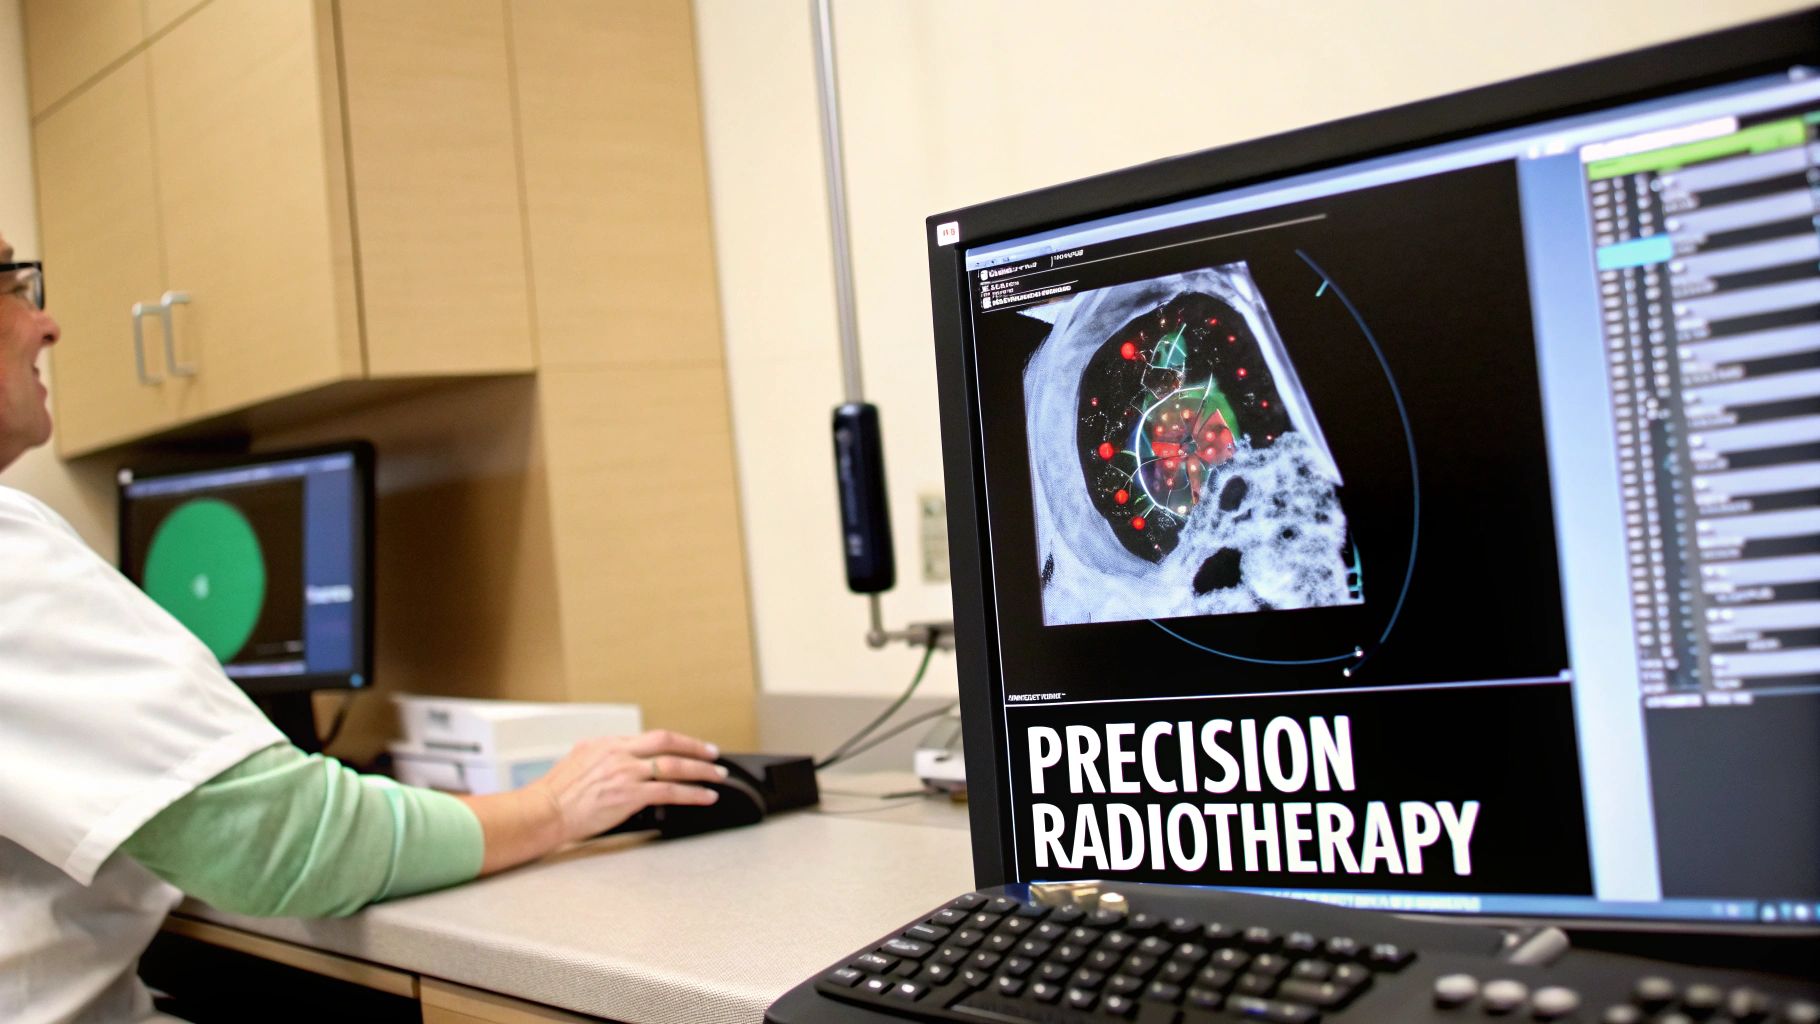
The Clinical Power of a DVH
A dose volume histogram is so much more than just a graph. It's a window into the future of a patient's treatment, transforming a complex sea of dose data into a clear, predictive picture. This is where the numbers on a screen truly start to shape a person's life, laying the groundwork for genuinely personalized, patient-first care.
The real power of the DVH comes to life when we use its data to calculate two of the most important metrics in radiation therapy: Tumor Control Probability (TCP) and Normal Tissue Complication Probability (NTCP). Think of these as the two sides of the treatment coin.
- Tumor Control Probability (TCP): This tells us the likelihood that our prescribed dose will actually eradicate the tumor. Naturally, getting this number as high as possible is the primary goal.
- Normal Tissue Complication Probability (NTCP): This calculates the risk of side effects or damage to healthy organs caught in the crossfire. Keeping this number low is absolutely critical for a patient's quality of life.
By carefully balancing these two probabilities, an oncology team can confidently thread the needle, choosing the plan with the best shot at a cure and the lowest risk of harm.
Turning Data Into Decisions
Think of it like walking a tightrope. On one side, you have the goal: safely reaching the other platform. On the other, the risk: a devastating fall. TCP and NTCP are the tools that allow clinicians to walk that tightrope with incredible precision.
For example, one treatment plan might promise a 95% chance of tumor control (TCP) but also come with a 15% risk of significant lung inflammation (NTCP). A different plan might drop that complication risk to just 5%, but at the cost of the TCP falling to 90%. The DVH is what makes this comparison possible. It provides the hard data needed for the clinical team, together with the patient, to decide which trade-off makes the most sense. This data-driven conversation is the heart of modern cancer care.
A great treatment plan isn't just about blasting a tumor with the highest possible dose. It's about finding that perfect equilibrium where the probability of a cure far outweighs the probability of complications. The dose volume histogram is what makes finding that sweet spot possible.
This predictive capability isn't guesswork; it's built on sophisticated models that link DVH data to real-world patient outcomes. Using both cumulative and differential DVHs, researchers can calculate TCP and NTCP with impressive accuracy. Models like the famous Lyman-Kutcher-Burman (LKB) model, for instance, use detailed DVH inputs to correlate the volume of tissue getting a certain dose with the likelihood of complications. This gives us a quantitative, evidence-based way to balance tumor control against toxicity. You can dive deeper into the full research on these predictive models to see exactly how the math works.
At PYCAD, our passion is pushing this field forward. We at PYCAD, build custom web DICOM viewers and integrate them into medical imaging web platforms, giving clinicians the powerful visualization tools they need to perform this critical work. Our solutions are designed to make complex data, like a dose volume histogram, immediately clear and actionable. We encourage you to take a look at our portfolio page to see how we’re helping to shape the future of medical imaging.
Turning Data into a Treatment Strategy
Visualizing this complex data is half the battle. This screenshot from our portfolio gives you a sense of the clear, intuitive interfaces we build at PYCAD to help clinicians manage these plans. We at PYCAD, build custom web DICOM viewers and integrate them into medical imaging web platforms, making it easier to see and understand the data that drives these critical decisions.
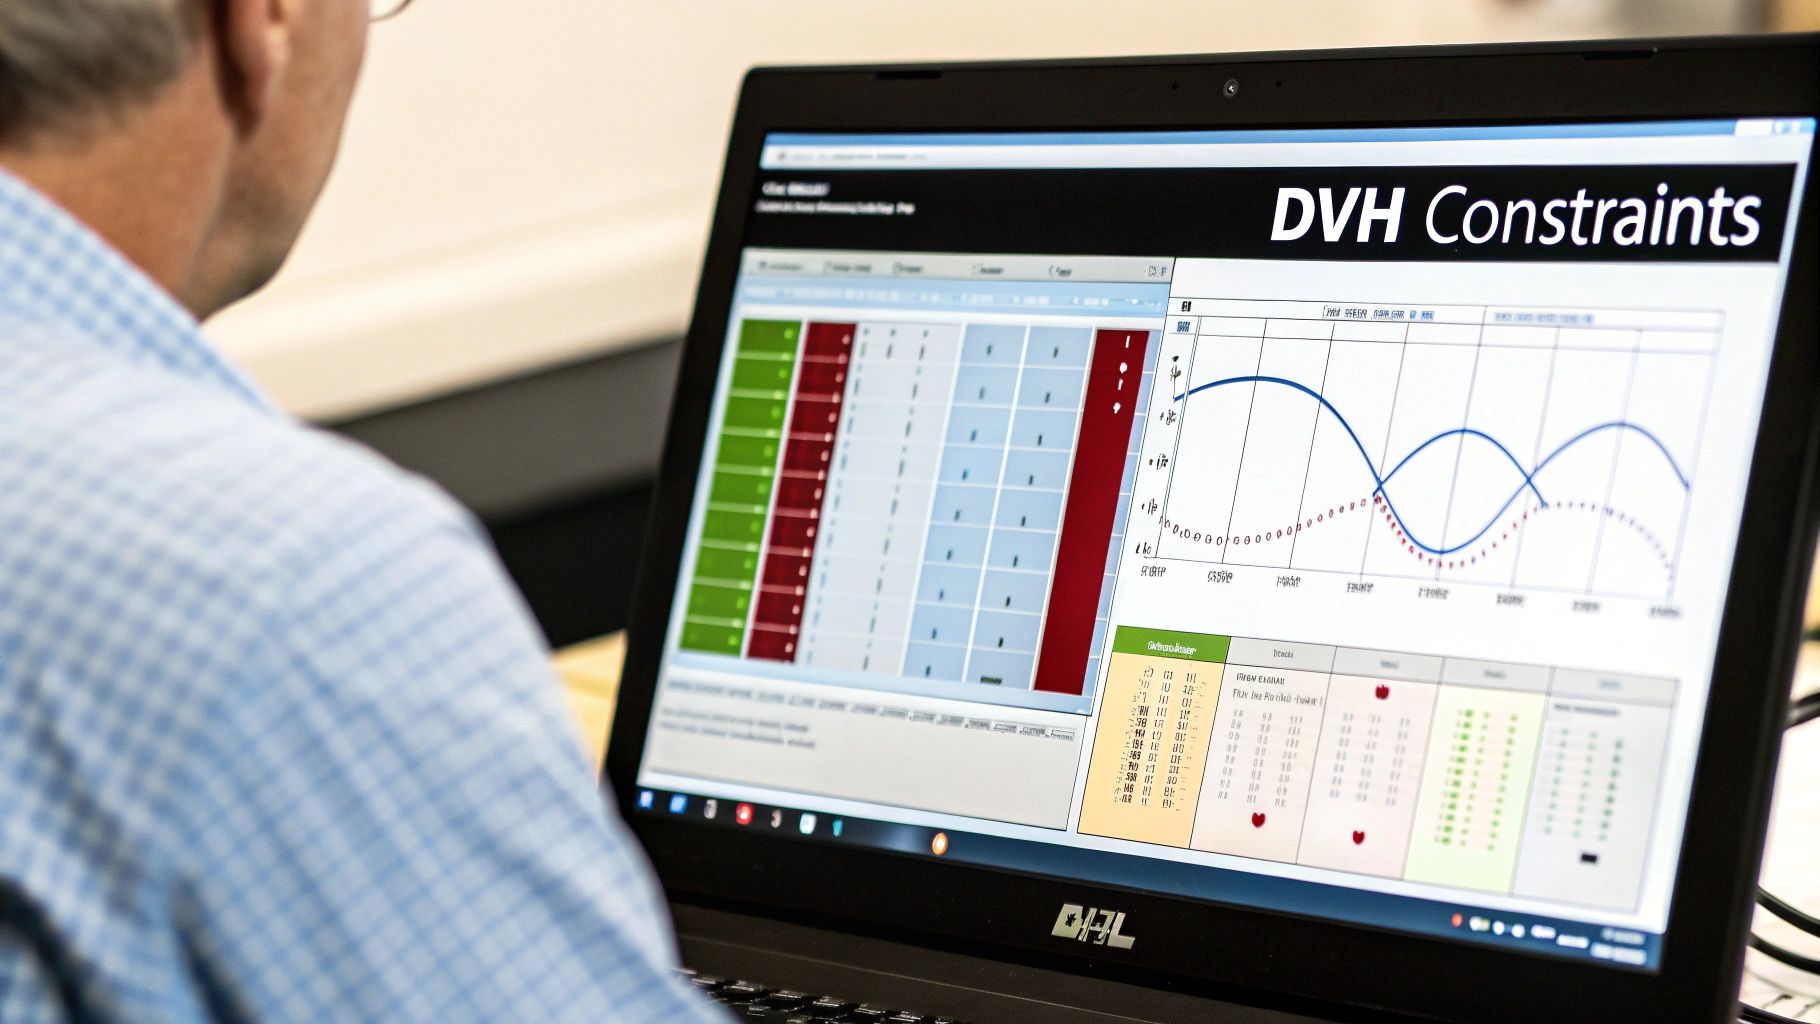
So, how do clinicians deliver a knockout blow to a tumor while building a protective shield around healthy organs? They turn the DVH from a simple report card into an active, guiding force in treatment planning. This is where DVH constraints come in.
Think of these constraints as the non-negotiable rules of the game. They are the strict boundaries you give the treatment planning software, defining what a safe and effective plan must look like.
Setting the Rules of Engagement
A planner’s job isn’t to create just one plan, but to find the best plan through a detailed process of refinement. This process is driven by clinical goals, which get translated directly into DVH constraints. These rules essentially force the planning software to weigh every option and find the ideal compromise between destroying the tumor and sparing healthy tissue.
Let’s take a classic lung cancer case. A clinician might set a critical rule: “No more than 20% of the total lung volume can receive a dose of 20 Gy or more (V20 < 20%).” This one line changes everything. The software now has to cycle through thousands of potential beam angles, shapes, and intensities to find a solution that not only covers the tumor but also strictly obeys this lung-sparing rule. For complex cases where the tumor moves as the patient breathes, you can see how we account for this in our guide on the role of 4D CT scans.
This data-driven approach is what makes modern radiotherapy so incredibly precise. A few other common DVH constraints include:
- Maximum Point Dose: For a structure as sensitive as the spinal cord, a planner might set a hard limit, like "the maximum dose cannot exceed 45 Gy." This is a firewall to prevent catastrophic damage.
- Mean Dose Limits: To preserve a patient's quality of life, a planner treating a head and neck cancer might limit the average dose to the parotid glands to maintain saliva function.
- Minimum Target Coverage: To make sure the treatment is effective, a constraint will demand something like, "at least 95% of the tumor volume must receive 100% of the prescribed dose (D95 > 100%)."
DVH constraints are the conductor's score in the symphony of radiation therapy. They instruct every element of the plan—every beam, every angle—to work in harmony to achieve a single, life-saving goal: destroying the tumor while preserving the patient.
This constant back-and-forth between the planner’s clinical expertise and the software’s number-crunching power is a dance of optimization. The DVH is the real-time map for that dance, showing the planner exactly how close they are to striking the perfect balance. It’s this powerful, iterative process that elevates radiotherapy from a blunt instrument to a tool of true precision.
The Future of AI-Powered Radiotherapy
For decades, the dose volume histogram has been a reliable workhorse in radiotherapy. It's the tool we've leaned on to judge our treatment plans. But now, thanks to artificial intelligence, its evolution is kicking into high gear. We're on the cusp of a major shift—moving from using the DVH to evaluate a finished plan to using AI to predict the DVH before a single beam is ever drawn.
This is the dawn of what's known as knowledge-based planning. Picture an AI that has studied thousands of successful treatment plans. It sees the subtle, complex connections between a patient's specific anatomy, their tumor's location, and the perfect dose distribution. This isn't science fiction; it's happening right now.
From Manual Art to Automated Science
With this technology, AI can forecast a highly accurate DVH for a new patient. It can suggest ideal dose constraints and flag which organs are most at risk, all before the heavy lifting of planning even begins. This gives medical dosimetrists an incredible head start and drives a new level of consistency. It helps us answer the critical question, "What does a great plan for this specific patient really look like?" by tapping into a massive library of past successes.
This isn't just a theory. A 2021 study that dug into predicting DVHs for complex treatments found an incredibly high correlation between the AI's predictions and the final, clinically approved plans. These models let us see the likely dose distribution with stunning accuracy, turning a sea of big data into truly personalized care. You can explore the full findings on DVH prediction models to see the data for yourself.
Artificial intelligence is transforming the DVH from a retrospective report card into a predictive blueprint. It gives us a glimpse into the ideal treatment outcome, guiding planners toward excellence from the very first step.
A Glimpse Into Tomorrow's Clinic
This marriage of AI and radiotherapy points to a future where treatment planning isn't just faster—it's fairer. Every patient gets to benefit from the collective wisdom learned from countless previous treatments. The old, manual process of tweaking and optimizing will be supercharged by AI-driven insights, freeing up clinicians to focus their expertise on the most complex and challenging cases.
At PYCAD, we are right in the middle of this evolution. We at PYCAD, build custom web DICOM viewers and integrate them into medical imaging web platforms, creating the essential foundation needed to see and interact with this next generation of AI-powered plans. See what's possible by visiting our portfolio page. As AI continues to advance, looking into new applications like those found in these agentic AI use cases in healthcare can offer a window into what’s next.
The dose volume histogram is no longer just a static graph. It’s becoming an intelligent, dynamic guide, leading us into an era of smarter, faster, and more personal radiotherapy.
Your DVH Questions, Answered
The dose volume histogram is a cornerstone of modern radiotherapy, but diving into its details often sparks more questions. As we explore how this powerful graph helps us create safer, more effective cancer treatments, it's natural to want a clearer understanding of its strengths and weaknesses. This curiosity is what drives us to achieve even greater precision for our patients.
Let's walk through some of the most common questions about the DVH to give you a more complete picture of how this vital tool works in the real world.
What’s the Main Limitation of a Dose Volume Histogram?
A standard DVH is brilliant, but its biggest blind spot is its lack of spatial information. Think of it like a book summary—you get the plot points, but you lose the richness of where everything unfolds in the story.
The DVH tells you how much of an organ gets a certain dose, but it doesn't show you where inside that organ the dose is. For example, a high dose concentrated in one small, vital spot could be far more damaging than the same dose spread thinly across a less critical area. That's why clinicians never, ever rely on the DVH alone. They always view it alongside the 3D dose distribution on their treatment planning system to get the full story.
How Does a Cumulative DVH Differ from a Differential DVH?
They might look similar, but these two DVH types tell slightly different tales.
The cumulative DVH is the workhorse of the clinic and the version we've been focusing on. It answers the question: "What volume of this structure is getting at least this much dose?" It's perfect for setting hard safety limits, like making sure the volume of the lung receiving 20 Gy (V20) stays below 30%.
A differential DVH, on the other hand, is more of a specialist. It shows the volume of tissue that receives a dose within a very narrow, specific range. It's fantastic for highlighting the most common dose delivered throughout a structure. While the cumulative DVH sets the non-negotiable safety rules, the differential DVH is more of an analytical tool for checking dose uniformity, especially inside the tumor itself.
Why Are DVHs So Important for Organs at Risk?
Simply put, the dose volume histogram is the guardian of a patient's healthy tissue. Every organ has a radiation tolerance—a line you just don't want to cross. Pushing past those limits can lead to serious, life-altering side effects.
The DVH is the tool that lets us quantify and control the dose delivered to these Organs at Risk (OARs) with incredible precision. It transforms abstract safety goals into concrete, measurable numbers. A planner can set a firm rule that the maximum dose to the spinal cord, for example, must not exceed a specific threshold. This ensures the treatment plan is not only powerful against the tumor but also deeply respectful of the patient’s future. It's this meticulous planning that protects a person's quality of life long after treatment ends.
A dose volume histogram gives us the confidence to be aggressive in our fight against cancer because it provides the roadmap to do so safely. It's our primary defense for protecting the healthy tissues that will support the patient for the rest of their life.
Can a DVH Change During Treatment?
Absolutely, and this is a huge area of focus in modern radiotherapy. The DVH created before treatment is just a snapshot based on the patient's anatomy on day one. But over a course of weeks, bodies change. Tumors shrink. Patients might lose weight. Internal organs can shift.
When that happens, the original DVH can become less accurate, which might mean healthy tissues start getting more radiation than planned. This challenge has given rise to a field called adaptive radiotherapy. This involves re-scanning a patient partway through their treatment course and creating a new plan based on their current anatomy. This ensures the DVH remains a true and accurate guide from the first day of treatment to the last, keeping the plan both safe and effective.
At PYCAD, we're passionate about building the tools that make this level of precision possible. We at PYCAD, build custom web DICOM viewers and integrate them into medical imaging web platforms, giving clinicians clear, intuitive ways to visualize and analyze complex data like the dose volume histogram. To see how we're helping to shape the future of medical imaging, we invite you to explore our work on our portfolio page.
Building radiotherapy imaging software?
PYCAD develops custom imaging platforms, DICOM viewers, dose visualization workflows, and AI-enabled analysis tools for teams working with radiotherapy, oncology imaging, and treatment-planning data.
Keep Reading
Related Articles
Explore the full Quantitative Imaging HubAll services, tools, and guides on this topic — in one place.
Visit Hub →