
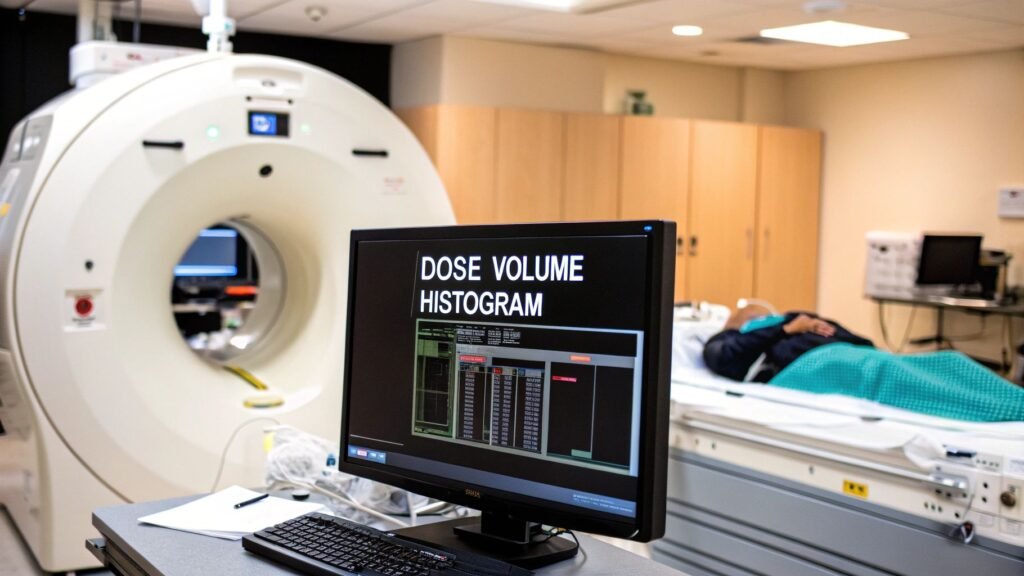
A dose volume histogram (DVH) is the radiotherapy graph: radiation dose on one axis, organ volume on the other. It answers two questions about a plan — is the target covered, and how much of each healthy organ is in the beam. It is not a standard uptake value. It is not a Hounsfield unit. It is not tissue perfusion.
If you meant PET SUV (activity / dose / weight) → standard uptake values. If you meant the SUVbw calculator → SUV calculator. If you meant CT density → Hounsfield units. If you meant tissue blood-flow → tissue perfusion. If you meant how large the tumor is → tumor volume calculation.
706 left this URL on purpose. Radiotherapy dose ≠ SUV. PYCAD builds custom web DICOM viewers and imaging models. It does not ship a treatment-planning system or a DVH product.
What the graph is
A 3D dose cube is hard to compare by eye. The DVH collapses each structure — the target, and each organ at risk (OAR) — into a curve. The horizontal axis is dose, usually in gray (Gy). The vertical axis is the fraction of that structure’s volume. A point on a cumulative curve reads: this much of the organ is getting at least this much dose.
Michael Goitein and colleagues put the idea into routine planning at the end of the 1970s so a plan could be judged as numbers instead of a stack of 2D isodose slices. The planning system still draws the 3D cloud. The DVH is the report card.
| Curve | What you want | Why |
|---|---|---|
| Target (PTV / CTV) | Steep, far right: nearly all of the volume at the prescribed dose | A shoulder or a tail to the left is under-coverage |
| OAR | Low and left: little volume at a high dose | A curve that climbs early is a lot of organ in the beam |
The numbers on the curve
| Metric | Reads as | Typical use |
|---|---|---|
| D95 | The dose that covers 95% of the target | A coverage check. A low D95 is a cold spot |
| V20 (lung) | The percent of lung receiving ≥ 20 Gy | A pneumonitis constraint. The threshold is protocol-specific; do not invent a universal cutoff here |
| Dmax | The hottest point in that structure | Serial organs (spinal cord). One voxel over the limit is the plan |
| Dmean | The average dose over the whole organ | Parallel organs (parotid, liver) where the whole-organ load matters |
Those numbers become constraints the optimiser has to obey: V20 below a named percent, cord Dmax below a named Gy, D95 at least the prescription. The planner still looks at the 3D dose. A DVH has no spatial map — a hot spot in a critical millimetre and the same dose smeared over a quiet corner look the same on the curve.
Cumulative vs differential
The clinic curve is almost always cumulative: volume receiving at least dose D. A differential DVH bins volume in a narrow dose window. It is how you see whether the target dose is a peak or a smear. Constraint language (V20, D95) is written on the cumulative form.
TCP (tumour-control probability) and NTCP (normal-tissue complication probability) are models that consume a DVH, not a second graph. Lyman–Kutcher–Burman is one named NTCP family. The output is a model, on a protocol, on a structure. This page does not reprint an unsourced “95% vs 15%” pair as if it were a law.
A plan DVH is a snapshot of day-one anatomy. Weight loss, a shrinking target, or a shifted organ can make that snapshot stale. Adaptive re-plan is a new CT and a new DVH, not a slogan. Motion during the beam is why some rooms use 4D CT.
What this page is not
- Not SUV. Activity / injected dose / weight → 6258. Calculator → 8098.
- Not HU, not perfusion. Density → 6213. Flow → 6246.
- Not a PYCAD planning product. No “dose visualization” SKU, no knowledge-based-planning platform, no simbie.ai outbound. Dropped.
- Not a sculptor metaphor or an Outrank figure. Dropped.
If a viewer has to show a dose cloud or a DVH next to the planning CT, that is the imaging piece. The plan itself is a treatment-planning system. Case studies.
Keep Reading
Related Articles
Explore the full Quantitative Imaging HubAll services, tools, and guides on this topic — in one place.
Visit Hub →