
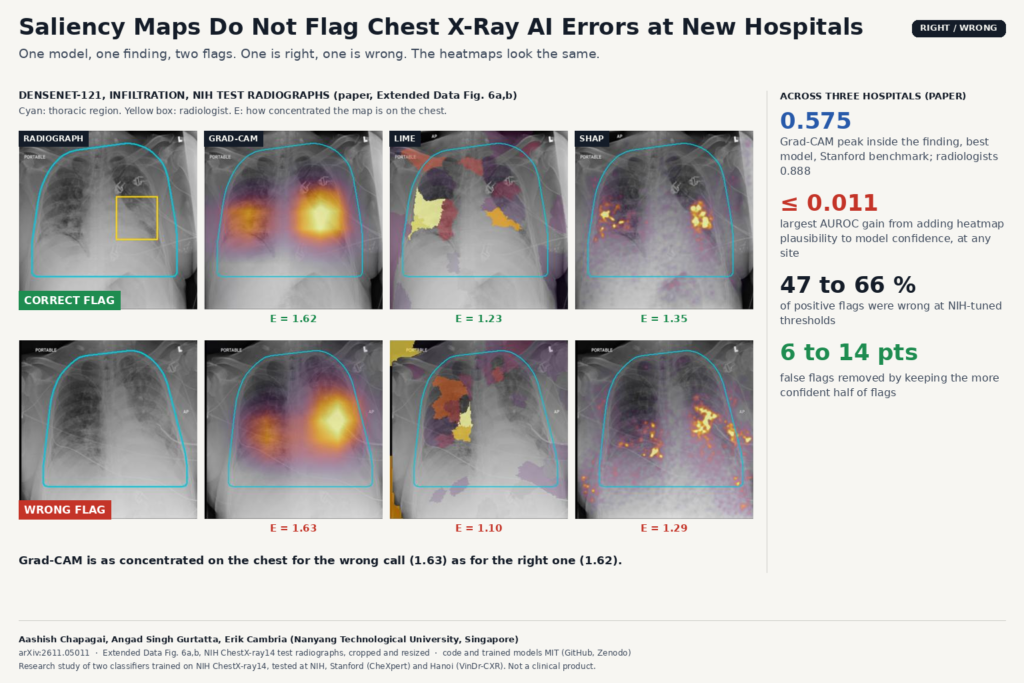
Almost every chest X-ray AI demo I see ships with a heatmap. The classifier says “infiltration”, a Grad-CAM overlay glows over the right lung, and the radiologist is supposed to glance at it and catch the cases where the model looked in the wrong place. In arXiv:2611.05011, Aashish Chapagai, Angad Singh Gurtatta and Erik Cambria from Nanyang Technological University in Singapore test whether that safety net works once a model leaves the hospital it was trained at. Their answer, across three sites and more than 300,000 decisions per model, is that it does not.
The paper is an external validation study with code and trained models released. If you put AI overlays into a DICOM viewer, read it before your next demo.
What the study does
The authors trained two common classifiers on NIH ChestX-ray14: a DenseNet-121 convolutional network and a ViT-B/16 vision transformer, each predicting 14 findings with thresholds tuned on NIH validation data. They then ran every decision at three places: the NIH internal test set, Stanford Hospital (CheXpert radiographs with radiologist outlines and a radiologist localization benchmark) and two hospitals in Hanoi (VinDr-CXR, with five-radiologist consensus labels and boxes). Twelve findings were harmonized across the three label sets.
For each decision they recorded three signals that need no ground truth at run time:
- The margin. How far the finding’s logit sits above or below its NIH-tuned threshold. This is the model’s own confidence for that call.
- The flip gap. How much the probability changes when the radiograph is mirrored, a cheap test-time augmentation check.
- Anatomical enrichment. The share of the heatmap that falls inside a thoracic region segmented from that radiograph (lungs and heart from HybridGNet, extended and dilated), divided by the share of the image that region covers. A value of 1 means the map is spread uniformly; higher means it is concentrated on the chest. They computed it for Grad-CAM on every decision and for LIME and SHAP on subsets of up to 500 radiographs per site.
Before running the analysis they wrote down three hypotheses: heatmaps become less concentrated at a new hospital, wrong flags have less plausible heatmaps than correct ones, and adding enrichment to the margin and flip gap improves error detection at new hospitals.
What they found
The featured image shows the problem in one picture. It is Extended Data Fig. 6 of the paper: two NIH test radiographs on which DenseNet-121 flagged infiltration. One flag is correct, one is wrong. Grad-CAM enrichment is 1.62 for the correct flag and 1.63 for the wrong one. Both maps sit on the lungs. Nothing in the overlay tells you which call to trust.
That pattern held at scale. On the Stanford benchmark, the Grad-CAM peak fell inside the radiologist’s outline for 0.575 of DenseNet-121 findings and 0.381 of ViT-B/16 findings, against 0.888 for radiologists marking the most representative point. The pre-specified test, adding enrichment to a margin plus flip-gap detector fitted at NIH, never raised the failure-detection AUROC by more than 0.011 at any site, for either model.
For DenseNet-121 the relation also reversed between hospitals. At NIH, more concentrated maps were slightly more often wrong once confidence was accounted for, so the detector fitted there gave enrichment a negative weight. In Hanoi the relation ran the other way, and the transferred detector got worse with enrichment than without it. A heatmap rule tuned before deployment can mislead after it.
Model confidence did better. The margin was the best single error signal in five of six model and site combinations, and keeping the more confident half of flags removed 6 to 14 percentage points of false flags at every site.
Why a viewer or clinic team should care
If you build a DICOM viewer or a clinical AI platform, heatmaps are often what gets demoed and what the buyer asks for. This paper is a clear reason to stop presenting them as an error check. A few practical changes follow from it:
- Show confidence next to every flag. Expose the margin to the threshold, or a calibrated probability, in the viewer and in the structured report, and sort or filter flags by it. That is the signal that tracked errors in this study.
- Re-tune thresholds locally. Operating points tuned at NIH did not transfer. With NIH thresholds, DenseNet-121 sensitivity for edema at Stanford fell from 0.424 to 0.008 even though ranking held up. Plan a local labelled sample before go-live, per site.
- Keep heatmaps as a display aid, labelled as such. They can still help a reader see where the evidence sits, but the UI copy should not suggest they confirm a finding.
- Monitor populations, not single heatmaps. Enrichment did shift between hospitals, so a drift dashboard could track it. The direction of the shift depended on finding and architecture, so a shift alone does not say whether calls got worse.
The paper also points out that for networks ending in global average pooling plus a linear layer, like DenseNet-121, Grad-CAM is an exact rearrangement of the class score. The map is not independent evidence about the decision it explains.
Where the study falls short
- Noisy internal labels. NIH labels are mined from reports, so some NIH “false positives” are probably real findings the labels missed. Both external sites used radiologist consensus.
- Few positives for some findings. CheXpert had 10 lesion and 16 pneumothorax positives, so per-finding estimates are imprecise.
- One explanation summary. Only spatial concentration on the chest was tested. Disagreement between explainers, which was large, might behave differently, and transformer-specific attribution methods were not tried.
- No reader study. The authors did not test how radiologists use heatmaps at a new hospital, which is the question a clinic ultimately has.
- Two research classifiers. Both models were trained on one public dataset and neither is a cleared product, so the numbers describe these research models and say nothing directly about a vendor’s system.
Code, weights and license
The code is public at github.com/aashish-chapagai/CXR-Saliency-External-Validation under the MIT license: seven notebooks covering preprocessing, training, HybridGNet anatomy masks, external data preparation and the Grad-CAM, LIME and SHAP analysis, plus the figure script and aggregate results. The trained DenseNet-121 and ViT-B/16 Keras models and their thresholds are archived on Zenodo, also MIT. No images are included. NIH ChestX-ray14 and CheXmask are open, CheXpert needs Stanford’s research use agreement and VinDr-CXR needs PhysioNet credentialed access. The preprint is under arXiv’s standard non-exclusive license. For related reading on PYCAD, see why a frozen pediatric chest X-ray threshold barely fires abroad and our older primer on explainable AI in healthcare.
My take
I like this paper because it tests the claim a lot of us make in sales decks and finds it wanting, with hypotheses written down before the analysis, two architectures, three explainers and three hospitals. Put the model’s confidence in front of the reader, re-tune thresholds at each site, and stop calling the heatmap a safeguard. If you want to check your own models, the released notebooks are a good template for running the same margin versus enrichment test on local data before go-live.