

Dice vs Dice loss is one overlap number used two ways: as a score you report (the Dice coefficient) and as a loss you minimise (usually 1 − that score). It is not a segmentation-methods article. It is not a PYCAD metrics product.
If you meant what a mask is, U-Net, threshold / watershed / atlas → medical image segmentation (7515 mentions Dice in one sentence as “accuracy is a Dice or IoU,” then moves on). If you meant a calculator → Dice coefficient calculator. If you meant sensitivity / specificity → what is sensitivity and specificity.
PYCAD builds custom web DICOM viewers and imaging models. It does not sell a “Dice engine.”
Dice coefficient (the score)
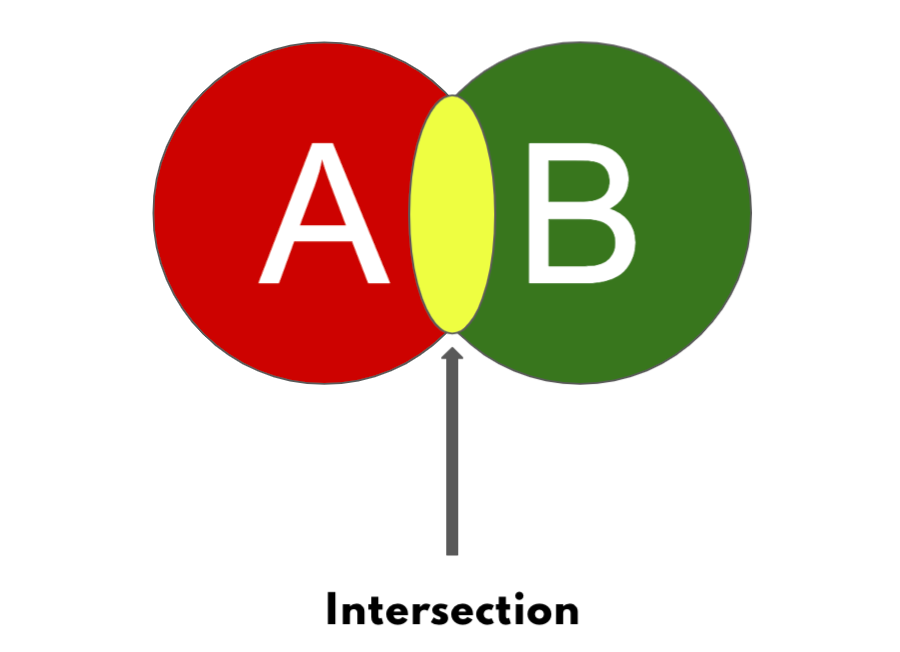
On a binary mask, Dice is two times the intersection of prediction A and ground truth B, divided by the sum of their sizes:
Dice(A, B) = 2 |A ∩ B| / (|A| + |B|)
Same idea as F1: it rewards overlap and punishes both extra pixels and missed pixels. Range is 0 (no overlap, if at least one mask has foreground) to 1 (the two masks are the same set).
| Case | Dice | What it means |
|---|---|---|
| A = B (same foreground) | 1 | Perfect overlap for that class |
| A ∩ B = ∅, and someone has foreground | 0 | No shared voxels |
| A = B = ∅ | undefined (0/0) | Empty vs empty. Implementations add a small ε or define it as 1 |
| Tiny lesion, one voxel off | collapses | Dice is harsh on small objects. A 0.90 on liver is not a 0.90 on a 5-voxel microbleed |
At validation / test you usually threshold the probabilities first, then compute hard Dice. That is the number in the paper table. A 0.90 on one hospital’s scanner is not a number you can paste onto the next vendor — 7515 already says that.
IoU / Jaccard is the other overlap: |A ∩ B| / |A ∪ B|. Related, not the same: Dice = 2 IoU / (1 + IoU). This page is Dice. Jaccard is one formula away, not a second article.
Dice loss (the training objective)
Optimisers minimise a loss. A score that should go up is a bad loss. The usual flip:
Dice loss = 1 − Dice
When Dice is 1, loss is 0. When Dice is 0, loss is 1. Gradients can flow if you compute Dice on soft probabilities (no argmax): treat each voxel’s predicted probability as a fractional membership, so |A ∩ B| becomes a sum of p · y. That is Milletari et al., V-Net, 2016 — the paper most stacks mean when they say “Dice loss.”
Variants you will actually meet:
- Soft Dice — the differentiable sum above. Default in MONAI / most U-Net repos.
- 1 − Dice, or −log(Dice) — same direction; the log version is steeper near 1.
- Dice + cross-entropy — Dice is weak when the object is huge and the interesting errors are on a thin edge; CE still cares about every voxel. Common combo, not a third metric.
- Class-wise then mean — one Dice per label, then average. A background class of “everything else” can fake a pretty mean. Report the foreground classes.
Empty-empty still needs a smoothing term (ε in numerator and denominator) so a batch with no positives does not NaN.
The two mistakes this URL exists to stop
- Calling the loss a metric. “We achieved a Dice loss of 0.12” is a training curve, not a paper number. Convert it (≈ 0.88 Dice) or, better, compute hard Dice on the held-out set.
- Training on hard Dice. Thresholding before the loss kills the gradient. Soft in the loop, hard on the report.
The diagrams on this URL (Venn of A / B / intersection, and the 1 − Dice flip) stay. They are the original figures, not a CDN.




What this page is not
- Not 7515 restated with a “Dice” costume. That URL is methods. This one is the score vs the loss.
- Not Hausdorff, surface Dice, or a full metrics cookbook. Those are other distances.
- Not the calculator restated as a blog post.
- Not a PYCAD evaluation product.
If the missing piece is a model that has to report a Dice a clinic will re-check on its own scanners, that is the imaging piece. Case studies.
Keep Reading
Related Articles
Explore the full Segmentation HubAll services, tools, and guides on this topic — in one place.
Visit Hub →